The arrows in Figures A–D represent possible movements of the exchange rate (euros per U.S. dollar) and the quantity of U.S. dollars buyers are willing and able to buy. Use these figures to answer the following questions. 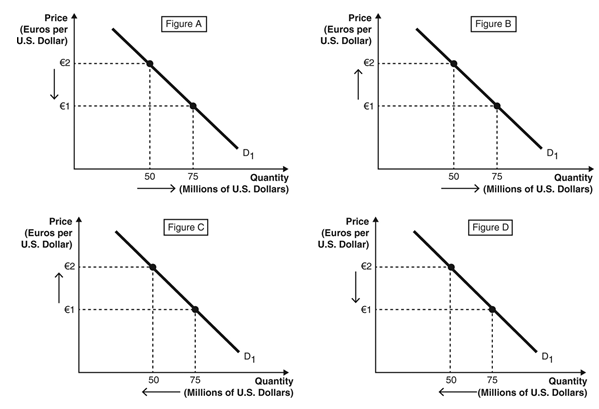
-An appreciation of the euro against the U.S.dollar is represented by Figure ________,and a depreciation of the U.S.dollar against the euro is represented by Figure ________.
Definitions:
Subsidy
A financial contribution provided by government to reduce the cost of producing goods or services and support businesses or consumers.
External Costs
Costs of an economic activity that are not borne by the parties directly involved in the transaction but by other individuals or society at large.
Supply Curve
A graph that represents the relationship between the price of a good and the quantity of the good that suppliers are willing to offer for sale.
Socially Optimal
A condition that maximizes societal welfare, often referring to the optimal distribution of resources and goods.
Q53: Which of the following explains contractionary monetary
Q74: Lassandra takes a sip of cola."Sweet ...cold,wet,tingly
Q94: Projective tests are based on the assumption
Q100: Capital account deficits are synonymous with<br>A) balance
Q112: Based on the scenario,Karl has<br>A) a comparative
Q116: The two types of monetary policy are<br>A)
Q126: _ is/are considered a liability on a
Q136: If the interest rate on a loan
Q139: On March 1,2016,the price of a surfboard
Q199: At the heart of the humanistic perspective