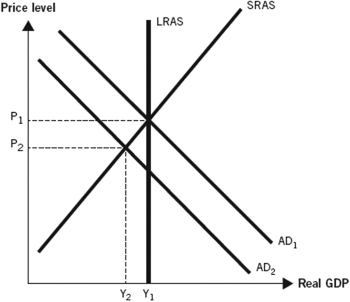
Use the following graph to answer the following questions.This graph depicts an economy where aggregate demand has decreased,with no change in either short-run aggregate supply (SRAS) or long-run aggregate supply (LRAS) .

-In the graph,aggregate demand decreases,causing a decrease in the aggregate price level and real gross domestic product (GDP) ,just like during the Great Depression.If short-run aggregate supply had decreased by the same margin as aggregate demand,how would the economy have behaved differently?
Definitions:
Child Development
The physical, cognitive, emotional, and social growth that occurs from infancy through adolescence.
Correlated
A statistical relationship between two variables where a change in one is associated with a change in the other.
Causally Related
Refers to events or variables that have a cause-and-effect relationship with one another.
Cross-sectional Research
A research method that involves analyzing data from a population, or a representative subset, at a specific point in time.
Q8: Explain how a change in real wealth
Q19: Assuming all of the following are in
Q45: The graph accurately summarizes what happened during
Q91: Country Y is in the midst of
Q96: Perfect summer weather increases farm output by
Q104: Today,total annual government outlays in the United
Q107: The Great Depression lasted longer and was
Q109: Which of the following describes the correct
Q114: Calculate the portion of M2 that was
Q143: Classical economists believe that when aggregate demand