Use the following information to answer the following questions.
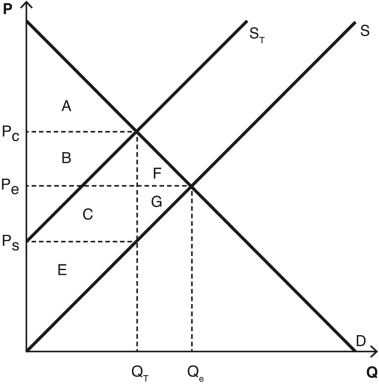
The following graph depicts a market where a tax has been imposed.Pe was the equilibrium price before the tax was imposed,and Qe was the equilibrium quantity.After the tax,PC is the price that consumers pay,and PS is the price that producers receive.QT units are sold after the tax is imposed.NOTE: The areas B and C are rectangles that are divided by the supply curve ST.Include both sections of those rectangles when choosing your answers.

-Which areas represent the revenue collected from this tax?
Definitions:
Q12: Which following change in the coffee market
Q26: Price controls can be traced back as
Q42: Explain why satellite TV service is a
Q88: In the U.S.sugar market<br>A) subsidies costs taxpayers
Q89: If the income elasticity of demand for
Q101: A policy option for reducing emissions is
Q135: Taxing a good with very elastic demand
Q138: Many consumer items eventually go out of
Q146: When market participants are allowed through their
Q169: Explain the difference between the burden of