Use the following information to answer the following questions.
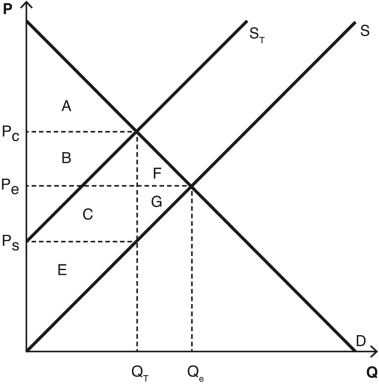
The following graph depicts a market where a tax has been imposed.Pe was the equilibrium price before the tax was imposed,and Qe was the equilibrium quantity.After the tax,PC is the price that consumers pay,and PS is the price that producers receive.QT units are sold after the tax is imposed.NOTE: The areas B and C are rectangles that are divided by the supply curve ST.Include both sections of those rectangles when choosing your answers.

-Which areas represent the total tax revenue created as a result of the tax?
Definitions:
Diversification
A strategy of investing in a variety of assets to reduce overall risk.
Expected Gain
The anticipated benefit or profit that arises from a specific action or investment.
Diversification
The process of spreading investment risks by acquiring a wide range of assets within a portfolio.
Expected Gain
A calculation or forecast regarding the potential benefits or profits that could be achieved in a specific situation or from a particular action.
Q8: After a new technology is introduced,the price
Q31: If a firm adds multiple layers of
Q98: Which of the following characteristics best defines
Q113: _ goods can be jointly consumed by
Q115: Given the current resources,one would need even
Q118: If the price elasticity of demand for
Q129: What is the total amount of producer
Q144: Use a figure with intersecting supply and
Q149: The government recently imposed a number of
Q153: The music you buy on the Internet