Use the accompanying graph to answer the following questions.
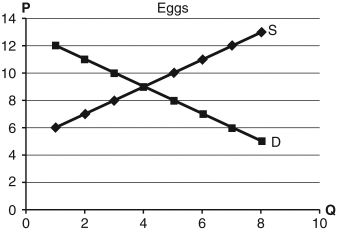
a.A study shows the many health benefits of eating eggs for breakfast.Demand rises by 6 units at each price.Draw this on the graph.
b.What is the percentage change in equilibrium price for eggs?
c.If the percentage change in quantity demanded for toast decreased by 1/2 of what you found in part (b)for eggs,what is the cross-price elasticity of demand for eggs and toast?
d.Will this be positive or negative? Are eggs and toast related to each other?
Definitions:
Strength Of Association
A measure indicating the relationship's intensity between two variables, showing how closely the variables are related.
Variables
Elements or characteristics within a study that can vary and have different values among subjects.
Correlation Coefficient
A statistical measure that calculates the strength and direction of the relationship between two variables.
Linear Regression
A statistical method for modeling the relationship between a dependent variable and one or more independent variables by fitting a linear equation.
Q10: When a tax is imposed on some
Q27: Given current resources and technology,the unattainable range
Q40: Which of the following is an accurate
Q70: Consumer surplus is the difference between<br>A) supply
Q76: The opportunity cost of increasing the production
Q78: Ireland's tax on plastic shopping bags successfully
Q102: Howard buys 5 suits a year when
Q109: What assumptions do economists make when developing
Q142: In the area of many college campuses,parking
Q151: The _ system encourages innovation by creating