Multiple Choice
Table 15-1
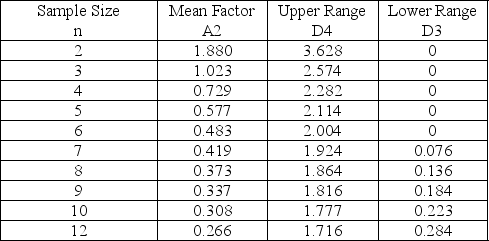
-Refer to Table 15-1.The average range of a process for packaging cereal is 1.1 ounces.If the sample size is 10, find the upper control chart limit for the range chart.
Definitions:
Related Questions
Q5: The Department of Motor Vehicles (DMV)can service
Q22: The difference in decision making under uncertainty
Q26: Transformations may be used when nonlinear relationships
Q38: In the long run, in Markov analysis<br>A)all
Q45: Which of the following distributions is most
Q56: Before drawing a PERT or CPM network,
Q68: W.Edwards Deming introduced control charts in the
Q68: According to the information provided in Table
Q90: What is the number of students that
Q97: The vector of state probabilities gives the