The time between arrivals at a drive-through window of a fast-food restaurant follows the distribution given below.The service time distribution is also given in the table below.Use the random numbers provided to simulate the activity of the first five arrivals.Assume that the window opens at 11:00 a.m.and the first arrival after this is based on the first interarrival time generated.
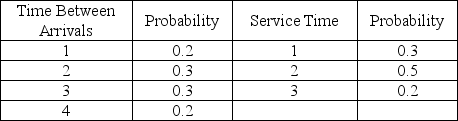 Random numbers for arrivals: 14, 74, 27, 03
Random numbers for service times: 88, 32, 36, 24
What times does the fourth customer leave the system?
Definitions:
Q9: The number of phone calls coming into
Q30: The c-chart is useful when we<br>A)take a
Q31: List the six steps in decision making.
Q43: The use of simulations in competitive situations
Q56: Interviews, statistical sampling, and company reports provide
Q73: What do we do when solving for
Q88: The matrix that is needed to compute
Q89: At what level of nightly order for
Q114: The initial state of a queuing system
Q125: The activity difference is the actual duration