Exhibit 25-1 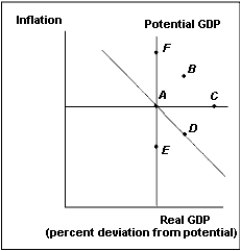
-Suppose the economy is initially at point A in Exhibit 25-1. If government purchases increase, which point best depicts where the economy will be in the short run as a result of the change in spending?
Definitions:
Monthly Revenues
The total income generated by a business or entity from its activities within a month.
Bar Graph
Also known as a bar chart, a graphic presentation of statistical information resembling the histogram except that there may not be a numeric scale on the horizontal axis and the bars normally do not touch each other.
Line Graph
A type of graph often used for illustrating data over time.
Histogram
A graphical representation of the distribution of numerical data, using bars of different heights to show frequencies of data within successive intervals.
Q12: The long-run overall effect of decreased government
Q15: In the economic fluctuations model, the so-called
Q16: Which of the following increases the likelihood
Q52: Which of the following would cause the
Q62: U.S. government debt in 2017 was approximately<br>A)$15,000
Q67: The actual unemployment rate will fall below
Q80: In setting interest rates, the Fed reacts
Q87: Expectations of steady inflation and staggered wage
Q99: There is a positive relationship between interest
Q153: Because it represents a completely separate section