The following table gives the quantities of output that can be produced with different amounts of capital and labor utilized by a firm.
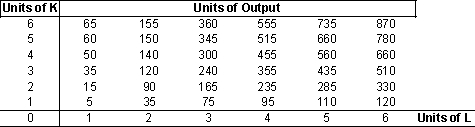

a. What are the returns to scale for this firm over the range of capital and labor shown on the table? Why?
b. Compute the marginal product and average product of capital for L = 3 as K varies from 1 unit to 6 units.
c. Compute the marginal product and average product of labor for K = 4 as L varies from 1 unit to 6 units.
d. Suppose the firm is producing 300 units of output using 4 units of capital and 3 units of labor. The cost of one unit of capital is $15.00 and the cost of one unit of labor is $75.00. Is the firm using a least cost combination of inputs? Why or why not?
Definitions:
Outlier
An observation in data that is significantly distant from the rest of the observations, often indicating a measurement or entry error, or a novel or extreme value.
Positively Associated
A relationship between two variables where they move in the same direction, implying that as one variable increases, the other one also increases.
Above-average Values
Above-average values refer to data points or observations that exceed the average or mean value of the data set.
Scatterplot
A scatterplot is a graphical representation used to display the relationship between two variables, with data points plotted on a Cartesian coordinate system.
Q7: Microeconomics is the branch of economic analysis
Q11: A large firm that is a price
Q15: Complete the following table, given that the
Q20: How might you word a primary and
Q24: At the point where MP<sub>L</sub> is equal
Q39: The value of owner-occupied houses and the
Q46: All of the following are examples of
Q49: Factors which are concerned with a specific
Q66: A firm produces two products, "r" and
Q79: Just as Brian walked into the room