Use the case below to answer the following question(s) .
The Tipton Hotel is considering a major remodeling effort and needs to determine the best combination of rates and suite sizes to maximize revenues.Currently,the hotel has 755 suites with the following history: 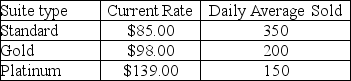 Each market segment has its own price/demand elasticity.Estimates are:
 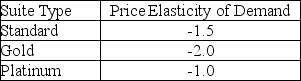 This means,for example,that a 1% decrease in the price of a standard suite will increase the number of suites sold by 1.5%.Similarly,a 1% increase in the price will decrease the number of suites sold by 1.5%.For any pricing structure (in $) ,the projected number of suites of a given type sold (we will allow continuous values for this problem) can be found using the formula:
(Historical average number of suites sold) + (Elasticity) (New price - Current price) (Historical average number of suites sold) /(Current price)
The hotel owners want to keep the price of a standard suite between $70 and $90; a gold suite between $90 and $110; and a platinum suite between $120 and $149.
Define S = price of a standard suite,G = price of a gold suite,and P = price of a platinum suite.
-Determine the projected revenue for selling the projected number of standard suites.
Definitions:
Industry Supply Curve
A graphical representation showing the total quantity of a good or service that producers in an industry are willing and able to supply at different price levels.
Marginal Cost Curves
A graphical representation showing how the cost of producing one more unit of a good varies with the quantity of the good produced.
AVC
Average Variable Cost, which is the total variable costs divided by the quantity of output produced.
Average Variable Cost
The total variable costs (costs that change with production volume) divided by the quantity of output produced.
Q3: Using the Tornado Chart tool,determine the assumption
Q6: Explain in brief the functions of Crystal
Q21: Niger,Sudan,Afghanistan,and Ethiopia are examples of what kind
Q47: In which of the following cases is
Q69: Which of the following is the capacity
Q76: If C<sub>i</sub>,R<sub>i</sub>,and P<sub>i</sub> (where i = 1,2,3…)are
Q90: The average life expectancy for a person
Q96: The number of work cycles started in
Q104: Production of which kind of commodities most
Q115: Richard sells his labour to the Small