Use the data shown below to answer the following question(s) .
Captain Jack Automobiles launched a new car and tabulated the below data for the new launch. 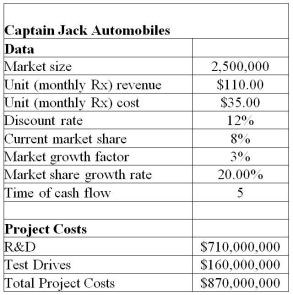 The project manager identified the following distributions and parameters for these variables:
Market size: normal with a mean of 2,000,000 units and a standard deviation of 400,000 units
R&D costs: uniform between $639,000,000 and $781,000,000
Test Drives: lognormal with mean of $160,000,000 and standard deviation $16,000,000
Annual market growth factor: triangular with minimum = 2%,maximum = 6%,and most likely = 3%
Annual market share growth rate: triangular with minimum = 15%,maximum = 25%,and most likely = 20%
Use 5,000 trials to generate the simulation model using Crystal Ball.
-In the NPV forecast chart generated after running the simulation,you enter the number 0 in the right range box of the forecast chart and press the enter key.What exactly is the result of the above action?
Definitions:
Supply
The total amount of a product or service available for purchase at any given time.
Equity Funds
Investment funds that primarily invest in stocks, aiming to provide investors with growth or income.
Indexed
The process of adjusting payments or values according to changes in a specified index, typically related to inflation or other economic indicators.
Management Costs
Expenses related to directing and controlling a business or part of a business, including salaries of managers and costs of administrative services.
Q6: Using Solver,identify the combination of the processes
Q7: The number of nonconforming items in each
Q49: What is the probability that the drug
Q53: Whose emphasis on social stability or the
Q57: What is the total projected revenue? (Hint:
Q72: The number of work cycles started in
Q73: For the above given data,the Decision Table
Q83: If S<sub>t</sub><sub> </sub><sub>- </sub><sub>s </sub><sub>+ </sub><sub>k</sub> is
Q86: For the given data set,what is the
Q89: Find the control limits for the <img