Use the data shown below to answer the following question(s) .
Captain Jack Automobiles launched a new car and tabulated the below data for the new launch. 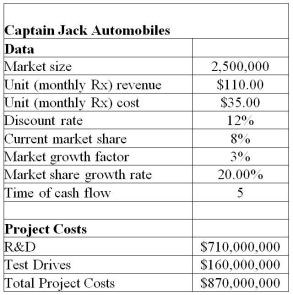 The project manager identified the following distributions and parameters for these variables:
Market size: normal with a mean of 2,000,000 units and a standard deviation of 400,000 units
R&D costs: uniform between $639,000,000 and $781,000,000
Test Drives: lognormal with mean of $160,000,000 and standard deviation $16,000,000
Annual market growth factor: triangular with minimum = 2%,maximum = 6%,and most likely = 3%
Annual market share growth rate: triangular with minimum = 15%,maximum = 25%,and most likely = 20%
Use 5,000 trials to generate the simulation model using Crystal Ball.
-For the given data set,what is the approximate percentage of risk that the NPV over the five years will not be positive?
Definitions:
Simple Random Sample
A sampling method where each member of the population has an equal chance of being selected, minimizing bias and ensuring representativeness.
Histogram
A graphical representation of the distribution of numerical data, often used to visualize the shape, spread, and central tendency of data.
Distribution
In statistics, the arrangement of values of a variable showing their observed or theoretical frequency of occurrence.
Normal Distribution
A bell-shaped distribution characterized by its mean and standard deviation, where the majority of data points are concentrated around the mean.
Q2: In which year has the company generated
Q3: If IRR is greater than the hurdle
Q26: In Crystal Ball,uncertain inputs are called _.<br>A)assumptions<br>B)decisions<br>C)forecasts<br>D)run
Q36: For the given data set,the probability of
Q72: Identify the constraint specified for 13-inch rolls.<br>A)7X<sub>2</sub>
Q79: The more uniform or consistent a process
Q85: Which of the following is not an
Q88: Using Solver,determine the amount to be shipped
Q99: What are patterned ways of acting,thinking,and feeling
Q139: The idea that individuals are wholly responsible