Use the data shown below to answer the following question(s) .
Captain Jack Automobiles launched a new car and tabulated the below data for the new launch. 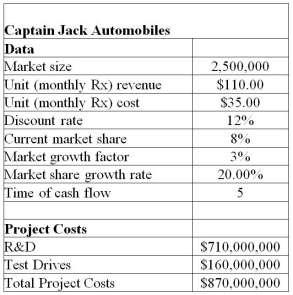 The project manager identified the following distributions and parameters for these variables:
Market size: normal with a mean of 2,000,000 units and a standard deviation of 400,000 units
R&D costs: uniform between $639,000,000 and $781,000,000
Test Drives: lognormal with mean of $160,000,000 and standard deviation $16,000,000
Annual market growth factor: triangular with minimum = 2%,maximum = 6%,and most likely = 3%
Annual market share growth rate: triangular with minimum = 15%,maximum = 25%,and most likely = 20%
Use 5,000 trails to generate the simulation model for NPV using Crystal Ball.
-Using the Tornado Chart tool,determine the assumption that has the least impact on the cumulative net profit for year 1.
Definitions:
Risk Of Default
The possibility or likelihood that a borrower will not be able to meet debt obligations, leading to financial losses for the lender.
Futures Contracts
Financial contracts obligating the buyer to purchase an asset (like a commodity or financial instrument) and the seller to sell the asset at a predetermined future date and price.
Forward Contracts
Financial derivatives that obligate the buyer to purchase and the seller to sell a specific asset at a predetermined future date and price.
Marked-To-Market
Marked-to-market refers to the practice of valuing assets or financial instruments based on their current market prices.
Q3: The <img src="https://d2lvgg3v3hfg70.cloudfront.net/TB2972/.jpg" alt="The -chart
Q3: What is the latest finish time for
Q6: In a simple regression model Y =
Q19: If the average arrival rate increases to
Q19: Compute the 99% confidence interval estimate of
Q32: In the inequality 3x + 4y ≤
Q46: Determine the probability that the system is
Q47: What is the terminal value if the
Q57: The null hypothesis _.<br>A)describes an existing theory
Q66: The best-fitting regression line minimizes the sum