Use the data shown below to answer the following question(s) .
Captain Jack Automobiles launched a new car and tabulated the below data for the new launch. 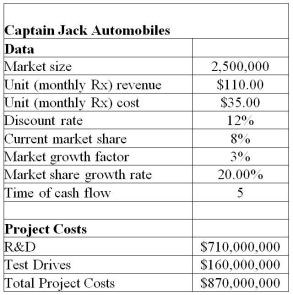 The project manager identified the following distributions and parameters for these variables:
Market size: normal with a mean of 2,000,000 units and a standard deviation of 400,000 units
R&D costs: uniform between $639,000,000 and $781,000,000
Test Drives: lognormal with mean of $160,000,000 and standard deviation $16,000,000
Annual market growth factor: triangular with minimum = 2%,maximum = 6%,and most likely = 3%
Annual market share growth rate: triangular with minimum = 15%,maximum = 25%,and most likely = 20%
Use 5,000 trials to generate the simulation model using Crystal Ball.
-In the NPV forecast chart generated after running the simulation,you enter the number 0 in the right range box of the forecast chart and press the enter key.What exactly is the result of the above action?
Definitions:
Developing Nations
Countries with a lower living standard, underdeveloped industrial base, and low Human Development Index relative to other countries.
Extreme Poverty
The condition where individuals live below the minimum income level considered necessary to meet basic needs, often defined as living on less than $1.90 a day.
Poverty Rate
The percentage of the population with incomes below the official poverty income levels that are established by the federal government.
World's Income
The total earnings from production and services by individuals and corporations around the globe, often considered in terms of Gross World Product.
Q5: What is the employee contribution at the
Q23: What is the best payoff rate for
Q46: The data for the number of action
Q47: In conducting the initial assessment of the
Q48: In most practical applications,the population standard deviation
Q49: The reduced cost associated with a bounded
Q86: Control limits are based on _.<br>A)past process
Q92: The formula for finding the standard deviation
Q98: Which of the following is the test
Q116: What do sociologists call a set of