Use the data given below to answer the following question(s) .
The table below shows the car sales from the year 2002-2007.The forecaster assumes a smoothing constant of 0.8 and uses the exponential smoothing model to determine the forecast for the future. 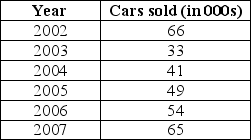
-In the double exponential smoothing model Ft+k = at + btk,identify the value that signifies the trend.
Definitions:
Explanatory Variable
A type of variable in statistical modeling that is used to explain variations in the dependent variable; it is also known as an independent variable.
Quantitative Variables
Variables that represent numerical amounts or quantities, which can be measured and expressed numerically.
Associated
Pertains to the connection or relationship between two or more variables or factors.
Response Variable
The outcome or variable of interest that is measured or observed in a study, experiment, or analysis to see how it is affected by explanatory variables.
Q15: The variance inflation factor for each variable
Q21: Using Crystal Ball for the data set
Q32: When a process is in statistical control,the
Q33: The Cp for a fully specified multiple
Q57: For the given Newsvendor model,which of the
Q59: If the null hypothesis is false,it is
Q64: Statisticians have determined that in order for
Q86: It has been reported that,on average,families in
Q95: Which of the following is an example
Q97: How are the probabilities for the sample