Use the data given below to answer the following question(s) .
The table below shows the industrial lathe sales from the years 2000-2005.The forecaster uses the regression method to determine the forecast for the future. 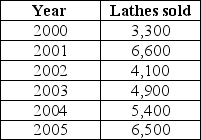
-For the data given above,the forecast for the year 2003 is approximately close to ________.
Definitions:
Level
The magnitude or position on a scale, often used to describe the intensity or degree of a certain variable in data analysis.
Trend
A general direction in which something is developing or changing, often identified through analysis of data over time.
Double Forecasting Model
A predictive analysis technique that utilizes two different forecasting methods to improve the accuracy of future predictions.
Seasonal Additive Model
An approach in forecasting that considers and adds seasonal components to predict trends and patterns.
Q7: The standard deviation of the portfolio is
Q12: In the first-order autoregressive model Y<sub>i</sub> =
Q20: The <img src="https://d2lvgg3v3hfg70.cloudfront.net/TB2972/.jpg" alt="The -chart
Q30: In the simple exponential smoothing model F<sub>t
Q47: The formula that is used to determine
Q69: All of the following are examples of
Q85: If the given time series exhibits seasonality
Q89: Find the control limits for the <img
Q91: The value of R<sup>2</sup> lies between -1
Q97: Setting k = 3,determine the value of