Use the data given below to answer the following question(s) .
The table below shows the car sales from the year 2002-2007.The forecaster assumes a smoothing constant of 0.8 and uses the exponential smoothing model to determine the forecast for the future. 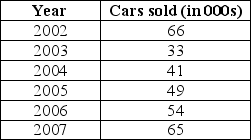
-From the data given above,what is the forecast-in 000s-for the year 2006?
Definitions:
Q3: The <img src="https://d2lvgg3v3hfg70.cloudfront.net/TB2972/.jpg" alt="The -chart
Q20: The power of the test represents the
Q24: How are control limits determined?
Q27: Which of the following is a subjective
Q28: R Square (R<sup>2</sup>)is also known as the
Q35: The control limits for p-charts are found
Q45: Hypothesis testing is a technique that allows
Q52: For the data given above,identify the Crystal
Q66: Given the probability of event G is
Q98: Which of the following is the test