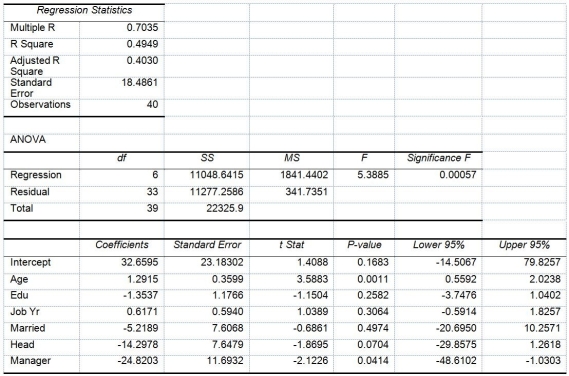
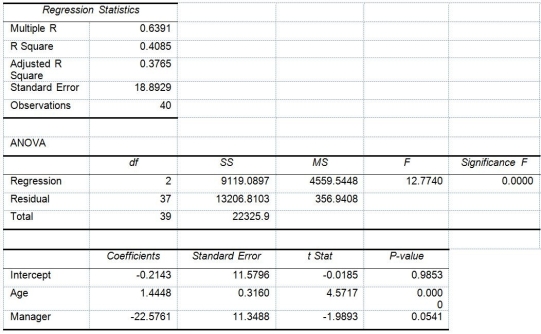
TABLE 17-10
Given below are results from the regression analysis where the dependent variable is the number of weeks a worker is unemployed due to a layoff (Unemploy) and the independent variables are the age of the worker (Age) ,the number of years of education received (Edu) ,the number of years at the previous job (Job Yr) ,a dummy variable for marital status (Married: 1 = married,0 = otherwise) ,a dummy variable for head of household (Head: 1 = yes,0 = no) and a dummy variable for management position (Manager: 1 = yes,0 = no) .We shall call this Model 1.The coefficient of partial determination (  ) of each of the 6 predictors are,respectively,0.2807,0.0386,0.0317,0.0141,0.0958,and 0.1201.
  Model 2 is the regression analysis where the dependent variable is Unemploy and the independent variables are Age and Manager.The results of the regression analysis are given below:
-Referring to Table 17-10,Model 1,which of the following is the correct alternative hypothesis to determine whether there is a significant relationship between the number of weeks a worker is unemployed due to a layoff and the entire set of explanatory variables?
Definitions:
Erotic Material
Content intended to arouse sexual feelings or desires, including literature, images, films, and other media.
Negative Effects
Unfavorable or harmful outcomes or impacts resulting from an action, condition, or behavior.
Hypothalamus
A region of the brain below the thalamus that coordinates both the autonomic nervous system and the activity of the pituitary, controlling body temperature, hunger, and many other processes.
Heterosexual
A sexual orientation characterized by a romantic or sexual attraction towards individuals of the opposite sex.
Q4: The research on protective factors has shown
Q12: Which of the following is not one
Q26: Referring to Table 14-4,the value of the
Q33: True or False: Referring to Table 17-8,the
Q38: Referring to Table 17-8,what are the lower
Q44: Referring to Table 16-14,in testing the coefficient
Q46: True or False: Referring to Table 18-9,based
Q59: Referring to Table 18-9,construct an R chart
Q74: True or False: The smaller the capability
Q271: Referring to Table 17-2,what is your decision