Examlex

Solved

TABLE 17-10 Given Below Are Results from the Regression Analysis Where the Where

question 64

True/False

TABLE 17-10
Given below are results from the regression analysis where the dependent variable is the number of weeks a worker is unemployed due to a layoff (Unemploy)and the independent variables are the age of the worker (Age),the number of years of education received (Edu),the number of years at the previous job (Job Yr),a dummy variable for marital status (Married: 1 = married,0 = otherwise),a dummy variable for head of household (Head: 1 = yes,0 = no)and a dummy variable for management position (Manager: 1 = yes,0 = no).We shall call this Model 1.The coefficient of partial determination ( TABLE 17-10 Given below are results from the regression analysis where the dependent variable is the number of weeks a worker is unemployed due to a layoff (Unemploy)and the independent variables are the age of the worker (Age),the number of years of education received (Edu),the number of years at the previous job (Job Yr),a dummy variable for marital status (Married: 1 = married,0 = otherwise),a dummy variable for head of household (Head: 1 = yes,0 = no)and a dummy variable for management position (Manager: 1 = yes,0 = no).We shall call this Model 1.The coefficient of partial determination (   )of each of the 6 predictors are,respectively,0.2807,0.0386,0.0317,0.0141,0.0958,and 0.1201.   Model 2 is the regression analysis where the dependent variable is Unemploy and the independent variables are Age and Manager.The results of the regression analysis are given below:   -True or False: Referring to Table 17-10,Model 1,the alternative hypothesis H<sub>1</sub> : At least one of β<sub>j</sub> ≠ 0 for j = 1,2,3,4,5,6 implies that the number of weeks a worker is unemployed due to a layoff is related to all of the explanatory variables. )of each of the 6 predictors are,respectively,0.2807,0.0386,0.0317,0.0141,0.0958,and 0.1201. TABLE 17-10 Given below are results from the regression analysis where the dependent variable is the number of weeks a worker is unemployed due to a layoff (Unemploy)and the independent variables are the age of the worker (Age),the number of years of education received (Edu),the number of years at the previous job (Job Yr),a dummy variable for marital status (Married: 1 = married,0 = otherwise),a dummy variable for head of household (Head: 1 = yes,0 = no)and a dummy variable for management position (Manager: 1 = yes,0 = no).We shall call this Model 1.The coefficient of partial determination (   )of each of the 6 predictors are,respectively,0.2807,0.0386,0.0317,0.0141,0.0958,and 0.1201.   Model 2 is the regression analysis where the dependent variable is Unemploy and the independent variables are Age and Manager.The results of the regression analysis are given below:   -True or False: Referring to Table 17-10,Model 1,the alternative hypothesis H<sub>1</sub> : At least one of β<sub>j</sub> ≠ 0 for j = 1,2,3,4,5,6 implies that the number of weeks a worker is unemployed due to a layoff is related to all of the explanatory variables. Model 2 is the regression analysis where the dependent variable is Unemploy and the independent variables are Age and Manager.The results of the regression analysis are given below: TABLE 17-10 Given below are results from the regression analysis where the dependent variable is the number of weeks a worker is unemployed due to a layoff (Unemploy)and the independent variables are the age of the worker (Age),the number of years of education received (Edu),the number of years at the previous job (Job Yr),a dummy variable for marital status (Married: 1 = married,0 = otherwise),a dummy variable for head of household (Head: 1 = yes,0 = no)and a dummy variable for management position (Manager: 1 = yes,0 = no).We shall call this Model 1.The coefficient of partial determination (   )of each of the 6 predictors are,respectively,0.2807,0.0386,0.0317,0.0141,0.0958,and 0.1201.   Model 2 is the regression analysis where the dependent variable is Unemploy and the independent variables are Age and Manager.The results of the regression analysis are given below:   -True or False: Referring to Table 17-10,Model 1,the alternative hypothesis H<sub>1</sub> : At least one of β<sub>j</sub> ≠ 0 for j = 1,2,3,4,5,6 implies that the number of weeks a worker is unemployed due to a layoff is related to all of the explanatory variables.
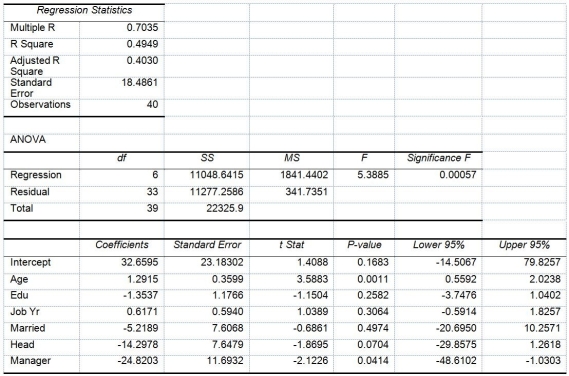
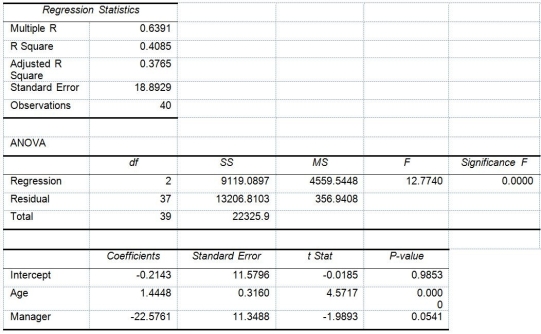
-True or False: Referring to Table 17-10,Model 1,the alternative hypothesis H1 : At least one of βj ≠ 0 for j = 1,2,3,4,5,6 implies that the number of weeks a worker is unemployed due to a layoff is related to all of the explanatory variables.


Definitions:

Safety Inventory

Extra inventory held as a buffer against demand variability and supply chain disruptions to prevent stockouts.

Cycle Inventory

The portion of inventory that companies hold to facilitate smooth production and sales operations, fluctuating based on production cycle needs.

Low-Value Product

Products that have a low price point or perceived economic value to the consumer, often resulting in slim profit margins.

High Demand

A situation where the desire and need for a product or service greatly exceeds the available supply within a market.

Related Questions