Examlex

Solved

TABLE 17-10 Given Below Are Results from the Regression Analysis Where the Where

question 284

True/False

TABLE 17-10
Given below are results from the regression analysis where the dependent variable is the number of weeks a worker is unemployed due to a layoff (Unemploy)and the independent variables are the age of the worker (Age),the number of years of education received (Edu),the number of years at the previous job (Job Yr),a dummy variable for marital status (Married: 1 = married,0 = otherwise),a dummy variable for head of household (Head: 1 = yes,0 = no)and a dummy variable for management position (Manager: 1 = yes,0 = no).We shall call this Model 1.The coefficient of partial determination ( TABLE 17-10 Given below are results from the regression analysis where the dependent variable is the number of weeks a worker is unemployed due to a layoff (Unemploy)and the independent variables are the age of the worker (Age),the number of years of education received (Edu),the number of years at the previous job (Job Yr),a dummy variable for marital status (Married: 1 = married,0 = otherwise),a dummy variable for head of household (Head: 1 = yes,0 = no)and a dummy variable for management position (Manager: 1 = yes,0 = no).We shall call this Model 1.The coefficient of partial determination (   )of each of the 6 predictors are,respectively,0.2807,0.0386,0.0317,0.0141,0.0958,and 0.1201.   Model 2 is the regression analysis where the dependent variable is Unemploy and the independent variables are Age and Manager.The results of the regression analysis are given below:   -True or False: Referring to Table 17-10 and using both Model 1 and Model 2,there is sufficient evidence to conclude that at least one of the independent variables that are not significant individually has become significant as a group in explaining the variation in the dependent variable at a 5% level of significance. )of each of the 6 predictors are,respectively,0.2807,0.0386,0.0317,0.0141,0.0958,and 0.1201. TABLE 17-10 Given below are results from the regression analysis where the dependent variable is the number of weeks a worker is unemployed due to a layoff (Unemploy)and the independent variables are the age of the worker (Age),the number of years of education received (Edu),the number of years at the previous job (Job Yr),a dummy variable for marital status (Married: 1 = married,0 = otherwise),a dummy variable for head of household (Head: 1 = yes,0 = no)and a dummy variable for management position (Manager: 1 = yes,0 = no).We shall call this Model 1.The coefficient of partial determination (   )of each of the 6 predictors are,respectively,0.2807,0.0386,0.0317,0.0141,0.0958,and 0.1201.   Model 2 is the regression analysis where the dependent variable is Unemploy and the independent variables are Age and Manager.The results of the regression analysis are given below:   -True or False: Referring to Table 17-10 and using both Model 1 and Model 2,there is sufficient evidence to conclude that at least one of the independent variables that are not significant individually has become significant as a group in explaining the variation in the dependent variable at a 5% level of significance. Model 2 is the regression analysis where the dependent variable is Unemploy and the independent variables are Age and Manager.The results of the regression analysis are given below: TABLE 17-10 Given below are results from the regression analysis where the dependent variable is the number of weeks a worker is unemployed due to a layoff (Unemploy)and the independent variables are the age of the worker (Age),the number of years of education received (Edu),the number of years at the previous job (Job Yr),a dummy variable for marital status (Married: 1 = married,0 = otherwise),a dummy variable for head of household (Head: 1 = yes,0 = no)and a dummy variable for management position (Manager: 1 = yes,0 = no).We shall call this Model 1.The coefficient of partial determination (   )of each of the 6 predictors are,respectively,0.2807,0.0386,0.0317,0.0141,0.0958,and 0.1201.   Model 2 is the regression analysis where the dependent variable is Unemploy and the independent variables are Age and Manager.The results of the regression analysis are given below:   -True or False: Referring to Table 17-10 and using both Model 1 and Model 2,there is sufficient evidence to conclude that at least one of the independent variables that are not significant individually has become significant as a group in explaining the variation in the dependent variable at a 5% level of significance.
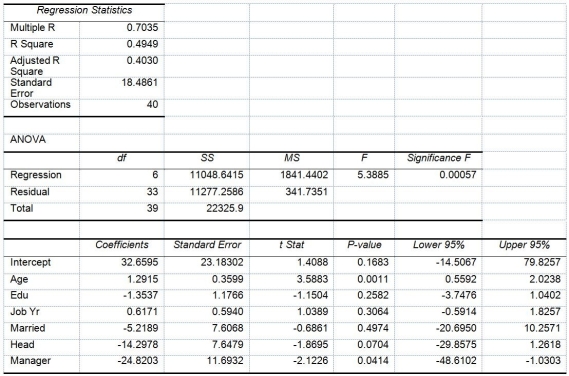
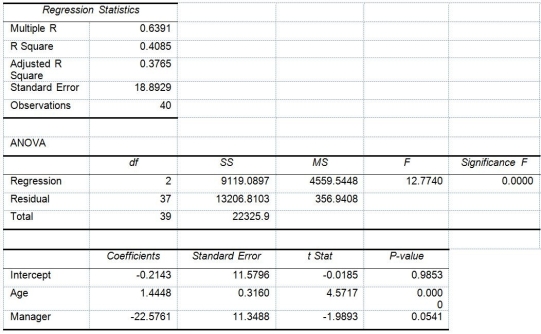
-True or False: Referring to Table 17-10 and using both Model 1 and Model 2,there is sufficient evidence to conclude that at least one of the independent variables that are not significant individually has become significant as a group in explaining the variation in the dependent variable at a 5% level of significance.

Recognize signs and symptoms associated with common infections.
Identify strategies for the prevention and control of infectious diseases.
Understand the concept of immunity and how vaccines work.
Describe the role of the body’s defense mechanisms in preventing infectious diseases.

Definitions:

Level of Significance

The probability threshold in hypothesis testing below which the null hypothesis is rejected, indicating statistical significance.

Type I Error

The mistake of rejecting the null hypothesis when it is actually true, often termed as a "false positive" in hypothesis testing.

Probability

A measure of the likelihood that an event will occur, expressed as a number between 0 and 1, where 0 indicates impossibility and 1 indicates certainty.

P-value

A statistical measure that indicates the probability of obtaining the observed results of a test, assuming that the null hypothesis is true.

Related Questions