TABLE 17-9
What are the factors that determine the acceleration time (in sec.)from 0 to 60 miles per hour of a car? Data on the following variables for 171 different vehicle models were collected:
Accel Time: Acceleration time in sec.
Cargo Vol: Cargo volume in cu.ft.
HP: Horsepower
MPG: Miles per gallon
SUV: 1 if the vehicle model is an SUV with Coupe as the base when SUV and Sedan are both 0
Sedan: 1 if the vehicle model is a sedan with Coupe as the base when SUV and Sedan are both 0
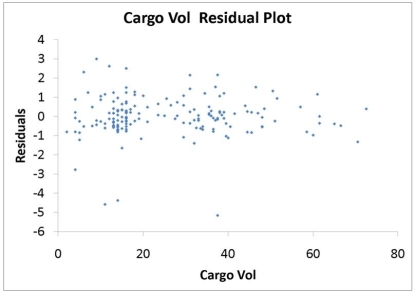
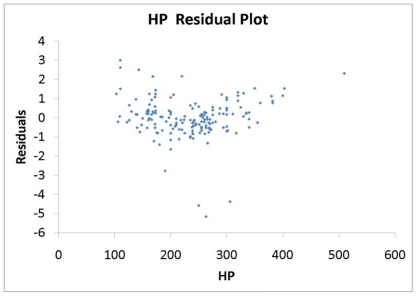
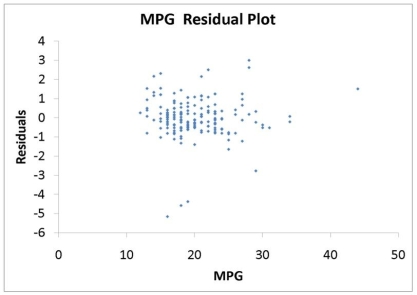
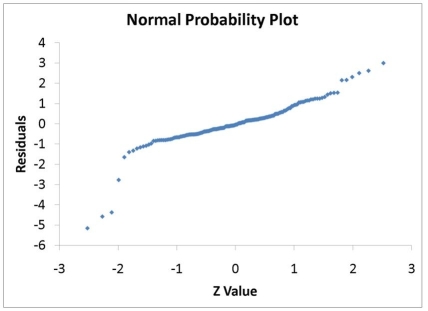
The regression results using acceleration time as the dependent variable and the remaining variables as the independent variables are presented below. 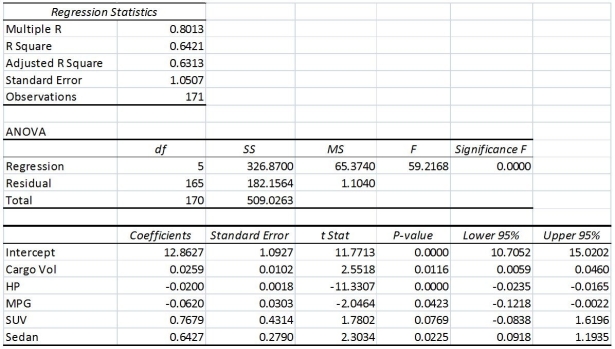 The various residual plots are as shown below.
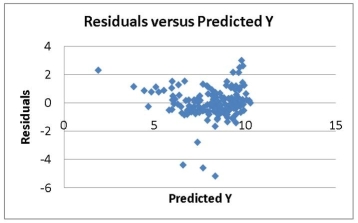
 The coefficient of partial determination (
  )of each of the 5 predictors are,respectively,0.0380,0.4376,0.0248,0.0188,and 0.0312.
The coefficient of multiple determination for the regression model using each of the 5 variables Xj as the dependent variable and all other X variables as independent variables (  )are,respectively,0.7461,0.5676,0.6764,0.8582,0.6632.
-True or False: Referring to Table 17-9,the 0 to 60 miles per hour acceleration time of a coupe is predicted to be 0.6427 seconds lower than that of a sedan.
Definitions:
Discount Rate
The interest rate used to discount future cash flows to their present value, often used in investment and project valuation.
Cash Inflows
Money or funds coming into a company, from operations, investments, or financing activities.
Useful Life
The estimated duration of time that an asset is expected to remain productive or useful for its intended purpose.
Labor Savings
The reduction in the amount of labor (and consequently, labor costs) necessary to perform a particular task or produce a certain amount of goods or services.
Q9: Referring to Table 14-3,to test for the
Q11: Referring to Table 15-1,what is the correct
Q12: Referring to Table 17-8,which of the following
Q18: True or False: The Paasche price index
Q29: Referring to Table 19-6,what is the return-to-risk
Q55: Referring to Table 19-1,if the probability of
Q62: Referring to Table 15-2,given a quadratic relationship
Q106: Referring to Table 18-7,construct an R chart
Q157: Referring to Table 16-14,to obtain a forecast
Q198: Referring to Table 14-5,when the microeconomist used