TABLE 17-10
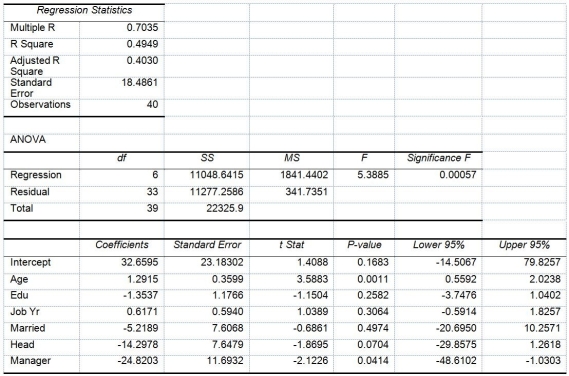
Given below are results from the regression analysis where the dependent variable is the number of weeks a worker is unemployed due to a layoff (Unemploy)and the independent variables are the age of the worker (Age),the number of years of education received (Edu),the number of years at the previous job (Job Yr),a dummy variable for marital status (Married: 1 = married,0 = otherwise),a dummy variable for head of household (Head: 1 = yes,0 = no)and a dummy variable for management position (Manager: 1 = yes,0 = no).We shall call this Model 1.The coefficient of partial determination (  )of each of the 6 predictors are,respectively,0.2807,0.0386,0.0317,0.0141,0.0958,and 0.1201.
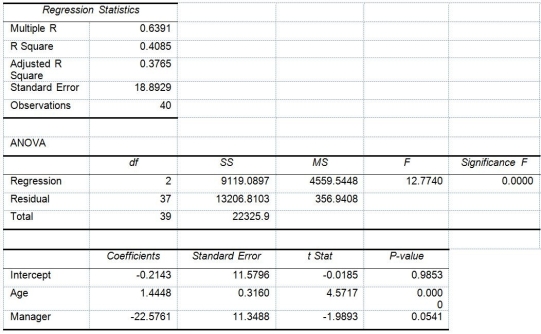
  Model 2 is the regression analysis where the dependent variable is Unemploy and the independent variables are Age and Manager.The results of the regression analysis are given below:
-Referring to Table 17-10,Model 1,what is the p-value of the test statistic when testing whether being married or not makes a difference in the mean number of weeks a worker is unemployed due to a layoff while holding constant the effect of all the other independent variables?
Definitions:
Feces
Unabsorbed food material and cellular waste that is expelled from the digestive tract.
Rectum
Terminal region of the large intestine; stores digestive waste.
Elimination
The process of removing or expelling waste materials from the body or from an ecological system.
BMI Cutoff
The threshold value of Body Mass Index that is used to categorize individuals into different weight statuses, such as underweight, normal, overweight, or obese.
Q2: Referring to Table 18-7,an R chart is
Q8: In reviewing the research regarding the risk
Q11: Which of the following is not true
Q15: Regarding body image<br>A)neither race nor gender matter<br>B)both
Q24: Referring to Table 19-5,what is the EOL
Q41: True or False: Referring to Table 17-12,the
Q69: Referring to Table 18-7,what is the value
Q79: Referring to Table 17-10,Model 1,which of the
Q107: Referring to Table 16-13,what is the exponentially
Q113: Referring to Table 16-6,the fitted trend value