TABLE 17-10
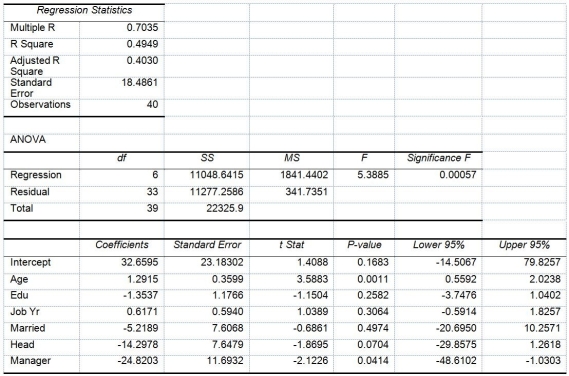
Given below are results from the regression analysis where the dependent variable is the number of weeks a worker is unemployed due to a layoff (Unemploy)and the independent variables are the age of the worker (Age),the number of years of education received (Edu),the number of years at the previous job (Job Yr),a dummy variable for marital status (Married: 1 = married,0 = otherwise),a dummy variable for head of household (Head: 1 = yes,0 = no)and a dummy variable for management position (Manager: 1 = yes,0 = no).We shall call this Model 1.The coefficient of partial determination (  )of each of the 6 predictors are,respectively,0.2807,0.0386,0.0317,0.0141,0.0958,and 0.1201.
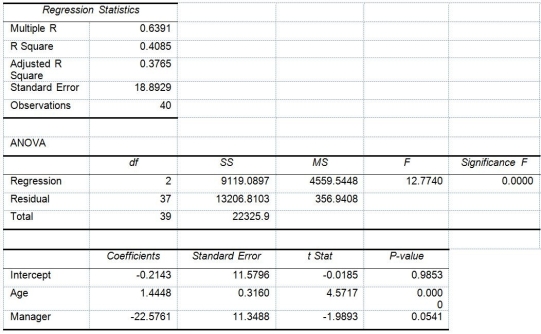
  Model 2 is the regression analysis where the dependent variable is Unemploy and the independent variables are Age and Manager.The results of the regression analysis are given below:
-Referring to Table 17-10,Model 1,which of the six independent variables (Age,Edu,Job Yr,Married,Head and Manager)is (are)insignificant in affecting the dependent variable using a 5% level of significance after taking into account the effect of the remaining independent variables?
Definitions:
Mean Difference
Mean difference is the measure of the average discrepancy between two sets of numbers, often used in comparing the central tendencies of two samples.
Null Hypothesis
A statement that assumes there is no significant difference or effect and serves as the starting point for hypothesis testing.
Significance Level
A threshold in statistical hypothesis testing that measures the probability of rejecting the null hypothesis when it is true, commonly set at values like 0.05 or 0.01.
SRS
Simple Random Sampling, a method of sampling where every individual has an equal chance of being selected from a population.
Q10: Referring to Table 14-5,at the 0.01 level
Q17: True or False: The coefficient of multiple
Q40: Referring to Table 18-7,an R chart is
Q56: True or False: In data mining where
Q119: Referring to Table 14-6,the value of the
Q188: Referring to Table 14-7,the value of the
Q210: Referring to Table 17-1,the observed value of
Q212: Referring to Table 14-4,_% of the variation
Q250: Referring to Table 17-11,what is the estimated
Q265: A Paso Robles wine producer wanted to