Examlex

Solved

TABLE 17-10 Given Below Are Results from the Regression Analysis Where the Where

question 195

True/False

TABLE 17-10
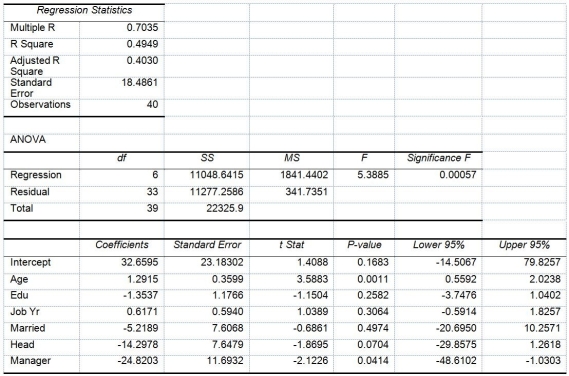
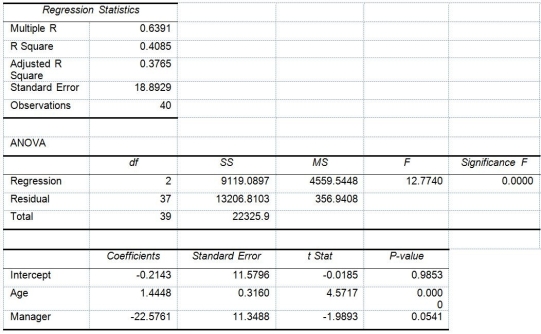
Given below are results from the regression analysis where the dependent variable is the number of weeks a worker is unemployed due to a layoff (Unemploy)and the independent variables are the age of the worker (Age),the number of years of education received (Edu),the number of years at the previous job (Job Yr),a dummy variable for marital status (Married: 1 = married,0 = otherwise),a dummy variable for head of household (Head: 1 = yes,0 = no)and a dummy variable for management position (Manager: 1 = yes,0 = no).We shall call this Model 1.The coefficient of partial determination ( TABLE 17-10 Given below are results from the regression analysis where the dependent variable is the number of weeks a worker is unemployed due to a layoff (Unemploy)and the independent variables are the age of the worker (Age),the number of years of education received (Edu),the number of years at the previous job (Job Yr),a dummy variable for marital status (Married: 1 = married,0 = otherwise),a dummy variable for head of household (Head: 1 = yes,0 = no)and a dummy variable for management position (Manager: 1 = yes,0 = no).We shall call this Model 1.The coefficient of partial determination (   )of each of the 6 predictors are,respectively,0.2807,0.0386,0.0317,0.0141,0.0958,and 0.1201.   Model 2 is the regression analysis where the dependent variable is Unemploy and the independent variables are Age and Manager.The results of the regression analysis are given below:   -True or False: Referring to Table 17-10 and using both Model 1 and Model 2,the null hypothesis for testing whether the independent variables that are not significant individually are also not significant as a group in explaining the variation in the dependent variable should be rejected at a 5% level of significance. )of each of the 6 predictors are,respectively,0.2807,0.0386,0.0317,0.0141,0.0958,and 0.1201. TABLE 17-10 Given below are results from the regression analysis where the dependent variable is the number of weeks a worker is unemployed due to a layoff (Unemploy)and the independent variables are the age of the worker (Age),the number of years of education received (Edu),the number of years at the previous job (Job Yr),a dummy variable for marital status (Married: 1 = married,0 = otherwise),a dummy variable for head of household (Head: 1 = yes,0 = no)and a dummy variable for management position (Manager: 1 = yes,0 = no).We shall call this Model 1.The coefficient of partial determination (   )of each of the 6 predictors are,respectively,0.2807,0.0386,0.0317,0.0141,0.0958,and 0.1201.   Model 2 is the regression analysis where the dependent variable is Unemploy and the independent variables are Age and Manager.The results of the regression analysis are given below:   -True or False: Referring to Table 17-10 and using both Model 1 and Model 2,the null hypothesis for testing whether the independent variables that are not significant individually are also not significant as a group in explaining the variation in the dependent variable should be rejected at a 5% level of significance. Model 2 is the regression analysis where the dependent variable is Unemploy and the independent variables are Age and Manager.The results of the regression analysis are given below: TABLE 17-10 Given below are results from the regression analysis where the dependent variable is the number of weeks a worker is unemployed due to a layoff (Unemploy)and the independent variables are the age of the worker (Age),the number of years of education received (Edu),the number of years at the previous job (Job Yr),a dummy variable for marital status (Married: 1 = married,0 = otherwise),a dummy variable for head of household (Head: 1 = yes,0 = no)and a dummy variable for management position (Manager: 1 = yes,0 = no).We shall call this Model 1.The coefficient of partial determination (   )of each of the 6 predictors are,respectively,0.2807,0.0386,0.0317,0.0141,0.0958,and 0.1201.   Model 2 is the regression analysis where the dependent variable is Unemploy and the independent variables are Age and Manager.The results of the regression analysis are given below:   -True or False: Referring to Table 17-10 and using both Model 1 and Model 2,the null hypothesis for testing whether the independent variables that are not significant individually are also not significant as a group in explaining the variation in the dependent variable should be rejected at a 5% level of significance.
-True or False: Referring to Table 17-10 and using both Model 1 and Model 2,the null hypothesis for testing whether the independent variables that are not significant individually are also not significant as a group in explaining the variation in the dependent variable should be rejected at a 5% level of significance.


Definitions:

Fixed Manufacturing Overhead

The portion of total manufacturing overhead costs that remains constant regardless of the level of production or activity volume.

Raw Material

Fundamental substances utilized during the manufacturing process to create products.

Standard Cost System

An accounting system that uses cost estimates for material, labor, and overhead to assign costs to products and analyze variances.

Fixed Manufacturing Overhead Rate

A consistent charge per unit of production or period that allocates the total fixed manufacturing overhead costs.

Related Questions