TABLE 17-10
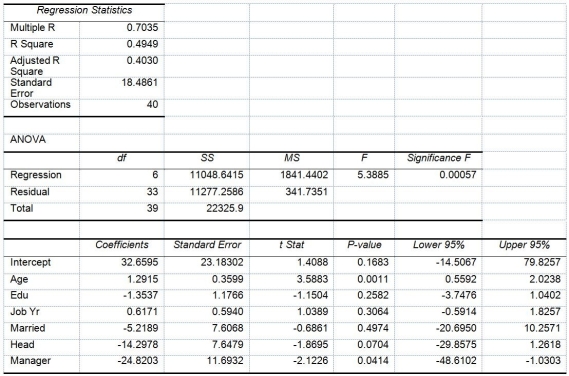
Given below are results from the regression analysis where the dependent variable is the number of weeks a worker is unemployed due to a layoff (Unemploy)and the independent variables are the age of the worker (Age),the number of years of education received (Edu),the number of years at the previous job (Job Yr),a dummy variable for marital status (Married: 1 = married,0 = otherwise),a dummy variable for head of household (Head: 1 = yes,0 = no)and a dummy variable for management position (Manager: 1 = yes,0 = no).We shall call this Model 1.The coefficient of partial determination (  )of each of the 6 predictors are,respectively,0.2807,0.0386,0.0317,0.0141,0.0958,and 0.1201.
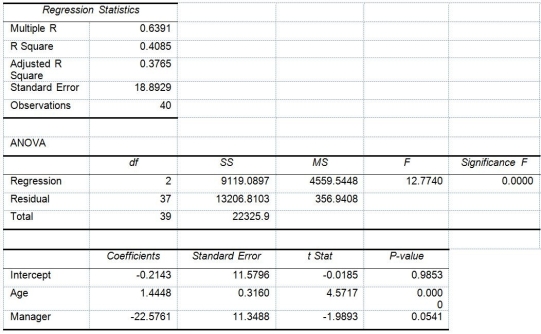
  Model 2 is the regression analysis where the dependent variable is Unemploy and the independent variables are Age and Manager.The results of the regression analysis are given below:
-True or False: Referring to Table 17-10 and using both Model 1 and Model 2,there is sufficient evidence to conclude that at least one of the independent variables that are not significant individually has become significant as a group in explaining the variation in the dependent variable at a 5% level of significance.
Definitions:
Q6: Referring to Table 16-5,the number of arrivals
Q21: Referring to Table 16-14,the best interpretation of
Q32: True or False: Referring to Table 15-6,the
Q36: Referring to Table 16-5,the number of arrivals
Q42: Referring to Table 18-3,suppose the sample mean
Q42: Referring to Table 17-8,what are the lower
Q47: Referring to Table 18-9,an R chart is
Q77: Referring to Table 16-12,to obtain a forecast
Q125: Referring to Table 16-13,if a five-month moving
Q126: Referring to Table 16-6,the fitted trend value