TABLE 16-9
Given below are EXCEL outputs for various estimated autoregressive models for a company's real operating revenues (in billions of dollars) from 1989 to 2012.From the data,you also know that the real operating revenues for 2010,2011,and 2012 are 11.7909,11.7757 and 11.5537,respectively.
First-Order Autoregressive Model: 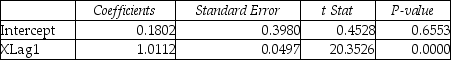 Second-Order Autoregressive Model:
 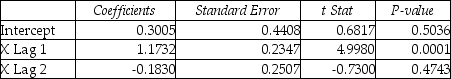 Third-Order Autoregressive Model:
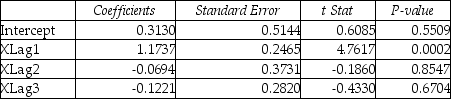
-Referring to Table 16-9,if one decides to use the Third-Order Autoregressive model,what will the predicted real operating revenue for the company be in 2013?
Definitions:
Q14: Referring to Table 14-5,what is the p-value
Q21: True or False: Common causes of variation
Q67: True or False: The purpose of a
Q86: True or False: Given a data set
Q140: An insurance company evaluates many variables about
Q141: True or False: In calculating the standard
Q191: Referring to Table 14-17,what are the numerator
Q214: Referring to Table 14-14,the fitted model for
Q271: True or False: Referring to Table 14-16,the
Q328: Referring to Table 14-17,what is the standard