TABLE 16-13
Given below is the monthly time-series data for U.S.retail sales of building materials over a specific year. 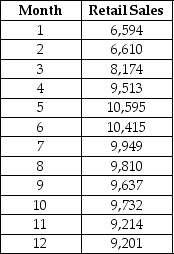 The results of the linear trend,quadratic trend,exponential trend,first-order autoregressive,second-order autoregressive and third-order autoregressive model are presented below in which the coded month for the 1st month is 0:
Linear trend model: 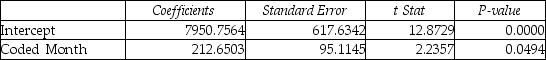 Quadratic trend model:
 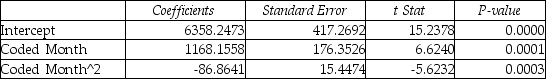 Exponential trend model:
 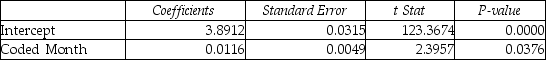 First-order autoregressive:
 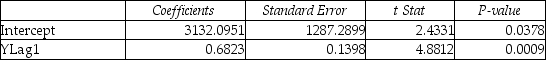 Second-order autoregressive:
 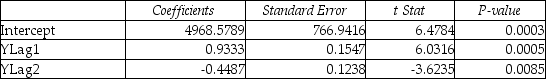 Third-order autoregressive:
 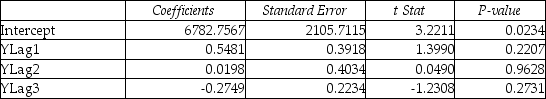 Below is the residual plot of the various models:
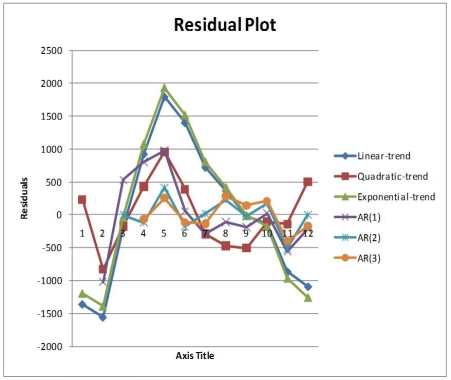
-True or False: Referring to Table 16-13,you can conclude that the second-order autoregressive model is appropriate at the 5% level of significance.
Definitions:
Q8: Referring to Table 15-5,what is the value
Q22: Referring to Table 16-15,what is the Laspeyres
Q82: True or False: Referring to Table 15-3,suppose
Q101: Referring to Table 16-13,what is the value
Q108: Referring to Table 14-4,one individual in the
Q109: True or False: Referring to Table 17-11,there
Q120: Referring to Table 16-4,exponential smoothing with a
Q124: The variation attributable to factors other than
Q202: Referring to Table 13-2,what is the estimated
Q315: Referring to Table 14-16,_ of the variation