TABLE 14-4
A real estate builder wishes to determine how house size (House) is influenced by family income (Income) and family size (Size) .House size is measured in hundreds of square feet and income is measured in thousands of dollars.The builder randomly selected 50 families and ran the multiple regression.Partial Microsoft Excel output is provided below: 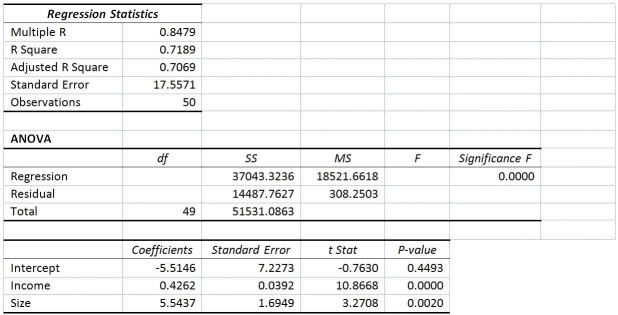 Also SSR (X1 ∣ X2) = 36400.6326 and SSR (X2 ∣ X1) = 3297.7917
-Referring to Table 14-4,which of the following values for the level of significance is the smallest for which each explanatory variable is significant individually?
Definitions:
F-distribution
A probability distribution that arises in the analysis of variance (ANOVA), used to compare variances and determine statistical significance.
T-distribution
A probability distribution that arises when estimating the mean of a normally distributed population in situations where the sample size is small and the population variance is unknown.
Sampling Distribution
The probability distribution of a given statistic based on a random sample.
Independent Sample Variances
A measure of the variability in each of two or more independent samples, used in hypothesis testing to assess the assumption of equal variances.
Q6: Referring to Table 16-5,the number of arrivals
Q9: Referring to Table 16-16,what is the Paasche
Q114: True or False: Referring to Table 14-17,we
Q119: True or False: Referring to Table 17-10,Model
Q161: Referring to Table 14-3,the p-value for the
Q185: Referring to Table 17-10,Model 1,_ of the
Q196: Referring to Table 13-3,the director of cooperative
Q219: True or False: Referring to Table 14-15,you
Q250: Referring to Table 14-18,what are the degrees
Q270: True or False: Referring to Table 17-8,there