TABLE 14-15
The superintendent of a school district wanted to predict the percentage of students passing a sixth-grade proficiency test.She obtained the data on percentage of students passing the proficiency test (% Passing),mean teacher salary in thousands of dollars (Salaries),and instructional spending per pupil in thousands of dollars (Spending)of 47 schools in the state.
Following is the multiple regression output with Y = % Passing as the dependent variable,X1 = Salaries and X2 = Spending: 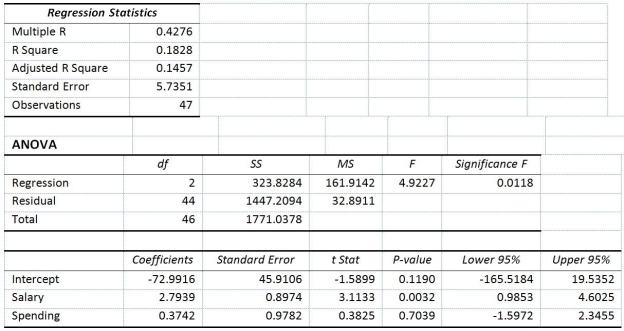
-True or False: Referring to Table 14-15,the null hypothesis H0 : β1 = β2 = 0 implies that percentage of students passing the proficiency test is not affected by either of the explanatory variables.
Definitions:
Demand for Inventoried Items
The need or desire for products or goods that are kept in stock for sale or distribution.
Reductions
Refers to decreases or cuts in quantities, capacities, workforce, costs, or other financial or operational metrics as a strategic or cost-saving measure.
Total Purchases
The aggregate amount of goods and services bought over a certain period of time.
Percentage of Sales
A financial metric or approach calculating a certain cost or investment as a proportion of sales revenue, useful in budgeting and analysis.
Q5: Referring to Table 16-4,a centered 3-year moving
Q32: Referring to Table 12-1,if the firm wanted
Q32: True or False: Referring to Table 13-10,the
Q37: Referring to Table 12-7,what are the values
Q131: True or False: Referring to Table 14-15,there
Q143: Referring to Table 12-15,what should be the
Q183: Referring to Table 14-12,if one is already
Q206: Referring to Table 14-18,what should be the
Q254: Referring to Table 14-3,to test whether aggregate
Q322: Referring to Table 14-7,the net regression coefficient