TABLE 14-17
Given below are results from the regression analysis where the dependent variable is the number of weeks a worker is unemployed due to a layoff (Unemploy) and the independent variables are the age of the worker (Age) and a dummy variable for management position (Manager: 1 = yes,0 = no) .
The results of the regression analysis are given below: 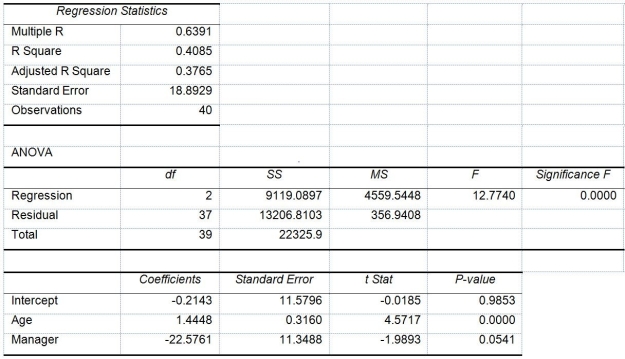
-Referring to Table 14-17,which of the following is a correct statement?
Definitions:
One-way ANOVA
A statistical test used to determine if there are statistically significant differences between the means of three or more independent (unrelated) groups based on one independent variable.
F-ratio
A statistical measure used in analysis of variance (ANOVA) to determine the degree of variation between sample means in comparison to variation within the samples.
Critical Value
A point on the test distribution that is compared to the test statistic to decide whether to reject the null hypothesis.
Degrees of Freedom
Refers to the number of independent values or quantities which can be assigned to a statistical distribution or a statistical test.
Q31: The sample correlation coefficient between X and
Q61: True or False: The Chancellor of a
Q146: Referring to Table 12-5,what is the value
Q154: Referring to Table 13-5,the value of the
Q157: True or False: Referring to Table 12-5,there
Q194: True or False: Referring to Table 14-15,the
Q203: Referring to Table 13-9,to test the claim
Q223: True or False: When an explanatory variable
Q262: True or False: The interpretation of the
Q267: Referring to Table 14-6,the coefficient of partial