TABLE 14-4
A real estate builder wishes to determine how house size (House)is influenced by family income (Income)and family size (Size).House size is measured in hundreds of square feet and income is measured in thousands of dollars.The builder randomly selected 50 families and ran the multiple regression.Partial Microsoft Excel output is provided below: 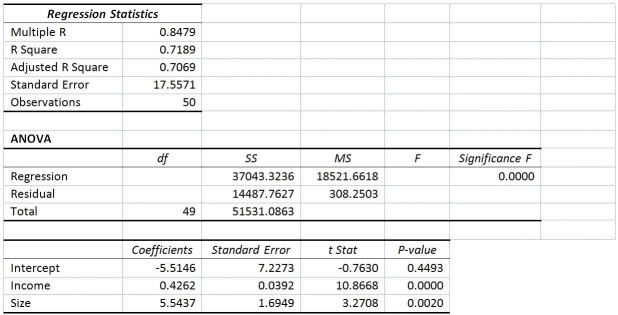 Also SSR (X1 ∣ X2)= 36400.6326 and SSR (X2 ∣ X1)= 3297.7917
-Referring to Table 14-4,one individual in the sample had an annual income of $40,000 and a family size of 1.This individual owned a home with an area of 1,000 square feet (House = 10.00).What is the residual (in hundreds of square feet)for this data point?
Definitions:
Sampling Distribution
A distribution indicating the probabilities of a statistic, which is calculated from a random sample.
Sample Proportion
The fraction of the sample that represents a particular attribute or characteristic.
Normal Probability Distribution
A bell-shaped distribution characterized by its mean and standard deviation, representing a continuous random variable.
Central Limit Theorem
A statistical theory that states that the distribution of sample means approximates a normal distribution as the sample size becomes larger, regardless of the population's distribution.
Q2: Referring to Table 17-10,Model 1,which of the
Q12: The logarithm transformation can be used<br>A)to overcome
Q23: True or False: Data that exhibit an
Q45: True or False: Referring to Table 15-6,the
Q50: True or False: Referring to Table 17-8,there
Q92: Referring to Table 15-2,is the overall model
Q164: Referring to Table 13-11,predict the revenue when
Q190: Referring to Table 14-9,if the variable that
Q285: Referring to Table 14-7,the department head wants
Q306: Referring to Table 14-3,to test for the