TABLE 14-11
A weight-loss clinic wants to use regression analysis to build a model for weight loss of a client (measured in pounds) .Two variables thought to affect weight loss are client's length of time on the weight-loss program and time of session.These variables are described below:
Y = Weight loss (in pounds)
X1 = Length of time in weight-loss program (in months)
X2 = 1 if morning session,0 if not
Data for 25 clients on a weight-loss program at the clinic were collected and used to fit the interaction model:
Y = β0 + β1X1 + β2X2 + β3X1X2 + ε
Output from Microsoft Excel follows: 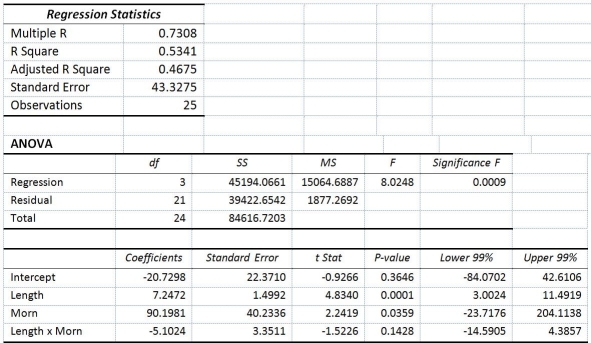
-Referring to Table 14-11,which of the following statements is supported by the analysis shown?
Definitions:
Conventional Charts
Traditional graphical representations of data, such as bar graphs, line charts, and pie charts, used to visualize information.
Line Charts
A type of chart that displays information as a series of data points connected by straight line segments, commonly used to visualize trends over time.
Vertical Axis
A line or scale along the side of a chart or graph that shows the value of something.
Horizontal Axis
In graphs and charts, the x-axis that runs left to right and typically represents the independent variable or time.
Q18: True or False: The stepwise regression approach
Q19: True or False: A trend is a
Q44: Referring to Table 12-2,the value of the
Q59: Referring to Table 16-3,suppose the last two
Q72: True or False: Two simple regression models
Q88: Referring to Table 14-16,what is the value
Q94: True or False: Referring to Table 14-19,there
Q159: Referring to Table 13-9,the p-value of the
Q200: Referring to Table 13-5,the standard error of
Q210: Referring to Table 14-19,what is the p-value