TABLE 14-17
Given below are results from the regression analysis where the dependent variable is the number of weeks a worker is unemployed due to a layoff (Unemploy)and the independent variables are the age of the worker (Age)and a dummy variable for management position (Manager: 1 = yes,0 = no).
The results of the regression analysis are given below: 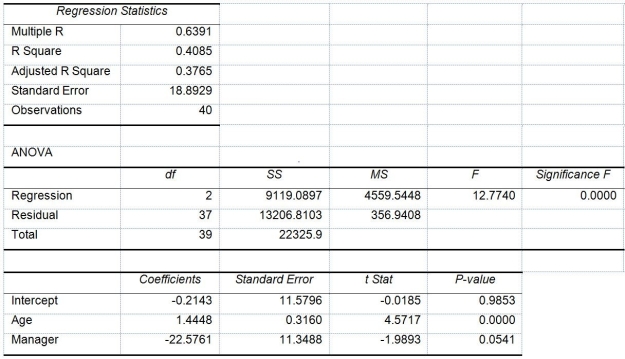
-True or False: Referring to Table 14-17,we can conclude definitively that,holding constant the effect of the other independent variable,age has an impact on the mean number of weeks a worker is unemployed due to a layoff at a 10% level of significance if all we have is the information of the 95% confidence interval estimate for the effect of a one year increase in age on the mean number of weeks a worker is unemployed due to a layoff.
Definitions:
Yield Management
A pricing strategy used in industries with fixed capacities to maximize revenue by adjusting prices based on demand.
Operations Management
is the area of management concerned with designing and controlling the process of production and redesigning business operations in the production of goods or services.
Demand Curve
A graph showing the relationship between the price of a good and the amount of the good that consumers are willing to purchase at that price.
Q24: Referring to Table 16-15,what are the simple
Q31: True or False: When a dummy variable
Q49: Referring to Table 14-17,which of the following
Q82: Referring to Table 12-3,the value of the
Q104: Referring to Table 11-2,the within group sum
Q132: Referring to Table 12-7,what are the values
Q134: True or False: Referring to Table 12-3,the
Q142: True or False: Referring to Table 12-7,the
Q156: Referring to Table 13-2,what is the standard
Q157: Referring to Table 14-7,the estimate of the