TABLE 14-18
A logistic regression model was estimated in order to predict the probability that a randomly chosen university or college would be a private university using information on mean total Scholastic Aptitude Test score (SAT) at the university or college, the room and board expense measured in thousands of dollars (Room/Brd), and whether the TOEFL criterion is at least 550 (Toefl550 = 1 if yes, 0 otherwise.) The dependent variable, Y, is school type (Type = 1 if private and 0 otherwise).
The Minitab output is given below: 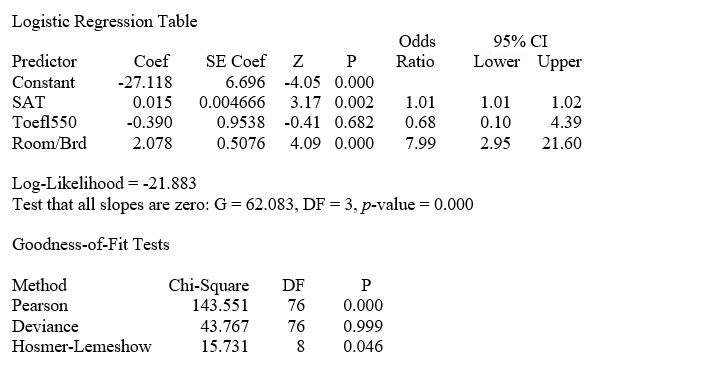
-Referring to Table 14-18, what is the p-value of the test statistic when testing whether the model is a good-fitting model?
Definitions:
Standard Error
The typical deviation found within the distribution of samples for a statistic, usually referring to the mean.
Independent Samples
Independent samples refer to two or more groups of data that are collected from separate, non-overlapping populations, ensuring they are not influenced by each other.
Normal Populations
The term "normal populations" relates to groups or sets of entities that exhibit characteristics distributed according to a normal (Gaussian) distribution.
Sampling Distribution
The likelihood distribution of a specific statistic derived from a random sample, which is utilized to draw conclusions about the broader population that the sample represents.
Q3: In a one-way ANOVA,if the computed F
Q18: If we wish to determine whether there
Q29: True or False: A high value of
Q35: Referring to Table 13-12,the estimated mean amount
Q39: Referring to Table 12-4,the calculated value of
Q40: Referring to Table 16-13,what is the p-value
Q49: True or False: Referring to Table 13-11,the
Q68: Referring to Table 12-1,what is the critical
Q125: Referring to Table 13-12,the value of the
Q177: Referring to Table 13-3,the standard error of