TABLE 13-11
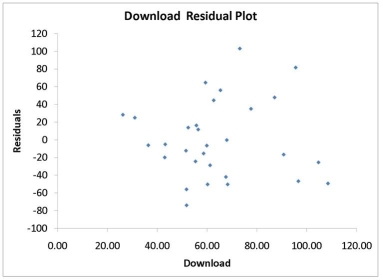
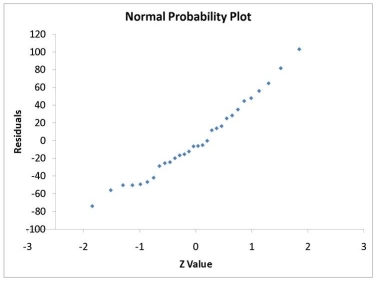
A computer software developer would like to use the number of downloads (in thousands) for the trial version of his new shareware to predict the amount of revenue (in thousands of dollars) he can make on the full version of the new shareware.Following is the output from a simple linear regression along with the residual plot and normal probability plot obtained from a data set of 30 different sharewares that he has developed: 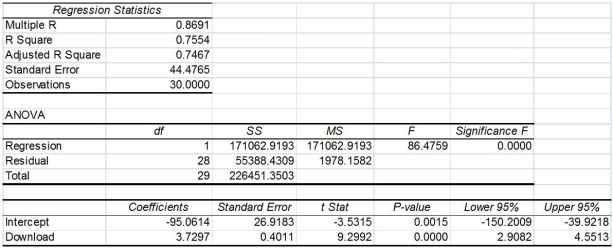
-Referring to Table 13-11,which of the following is the correct null hypothesis for testing whether there is a linear relationship between revenue and the number of downloads?
Definitions:
Production Function
A mathematical model that describes the relationship between input resources and output of goods or services in the production process.
Price of Capital
The cost of using capital for production or investment, often represented by interest rates or return on investment.
Manufacturing Plant
A large industrial building designed for the production of goods, using various processes and machinery, in a structured and efficient manner.
Total Cost
The full amount of expenses incurred by a firm in the production of goods or services, including both fixed and variable costs.
Q2: Referring to Table 12-12,if the null hypothesis
Q10: Referring to Table 11-10,what is the value
Q18: Referring to Table 11-11,is it appropriate to
Q22: Testing for the existence of correlation is
Q54: True or False: Referring to Table 11-10,the
Q95: Referring to Table 14-3,to test for the
Q106: True or False: Regression analysis is used
Q161: Referring to Table 14-3,the p-value for the
Q193: Referring to Table 14-3,the p-value for GDP
Q317: Referring to Table 14-15,what are the lower