TABLE 13-2
A candy bar manufacturer is interested in trying to estimate how sales are influenced by the price of their product. To do this, the company randomly chooses 6 small cities and offers the candy bar at different prices. Using candy bar sales as the dependent variable, the company will conduct a simple linear regression on the data below: 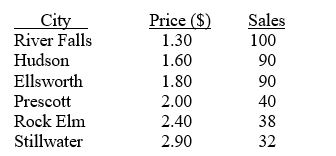
-Referring to Table 13-2, what percentage of the total variation in candy bar sales is explained by prices?
Definitions:
Hypothesis Test
A statistical method used to determine the probability that a hypothesis regarding a specific characteristic of a population is true.
P-value
The p-value is a measure in statistics that helps determine the significance of results, indicating the probability of observing the given results, or more extreme, by chance if a null hypothesis were true.
Democratic Candidate
An individual running for political office who is a member of or endorsed by the Democratic Party.
Surgical Site Infections
Infections that occur after surgery in the part of the body where the surgery took place.
Q4: Referring to Table 16-15,what is the Paasche
Q11: Referring to Table 16-16,what are the simple
Q30: Referring to Table 16-15,what is the Paasche
Q61: Referring to Table 14-16,what is the value
Q80: True or False: Referring to Table 13-10,the
Q95: Referring to Table 12-6,what is the p-value
Q95: Referring to Table 13-2,what is the estimated
Q123: Referring to Table 12-6,what is the value
Q127: The F test statistic in a one-way
Q204: True or False: Referring to Table 13-10,the