TABLE 11-11
A student team in a business statistics course designed an experiment to investigate whether the brand of bubblegum used affected the size of bubbles they could blow.To reduce the person-to-person variability,the students decided to use a randomized block design using themselves as blocks.
Four brands of bubblegum were tested.A student chewed two pieces of a brand of gum and then blew a bubble,attempting to make it as big as possible.Another student measured the diameter of the bubble at its biggest point.The following table gives the diameters of the bubbles (in inches)for the 16 observations. 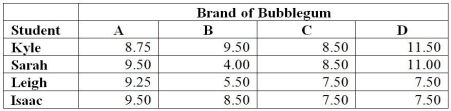
-True or False: Referring to Table 11-11,the decision made at a 0.05 level of significance on the F test for the block effects implies that the blocking has been advantageous in reducing the experiment error.
Definitions:
Column Variable
A variable represented by a column in a dataset, where each entry in the column represents a value of the variable.
Degrees of Freedom
In statistics, it refers to the number of independent values or quantities which can be assigned to a statistical distribution, less the number of parameters estimated.
Chi-Square
A statistical test used to assess the differences between categorically grouped data by comparing the observed frequencies of groups with expected frequencies derived from a hypothesis.
Row Variable
A variable that constitutes the basis for organizing data in rows in a table or matrix, often used in cross-tabulation.
Q9: Referring to Table 9.3,the value of the
Q10: Referring to Table 12-20,what are the lower
Q11: Which of the following would be an
Q17: Referring to Table 11-5,what should be the
Q24: True or False: Referring to Table 11-3,based
Q68: Referring to Table 10-12,the null hypothesis will
Q86: Referring to Table 12-2,the p-value of the
Q115: Referring to Table 11-8,what degrees of freedom
Q128: Referring to Table 12-15,what is the value
Q164: Referring to Table 12-16,the calculated value of