TABLE 10-13
The amount of time required to reach a customer service representative has a huge impact on customer satisfaction. Below is the Excel output from a study to see whether there is evidence of a difference in the mean amounts of time required to reach a customer service representative between two hotels. Assume that the population variances in the amount of time for the two hotels are not equal.
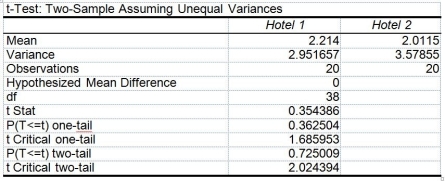
-Referring to Table 10-13, what is the largest level of significance at which a test on a difference in the variabilities of the amount of time required to reach a customer service representative between the two hotels will not be rejected?
Definitions:
M/M/1 Model
A mathematical model used in queueing theory to describe a single server queue with Poisson arrivals and exponentially distributed service times.
M/D/1 Model
A queueing model where arrivals are Markovian (M), service times are deterministic (D), and there is one server (1).
Arrival Rate
In queuing theory, the average number of items or individuals arriving at a service facility within a specified period.
Service Rate
The speed or efficiency with which a service is delivered, often measured to assess the performance of service-oriented operations.
Q3: True or False: Referring to Table 8-16,the
Q54: You have created a 95% confidence interval
Q60: Referring to Table 11-4,the null hypothesis will
Q67: Referring to Table 8-8,the critical value for
Q93: Referring to Table 11-9,the mean square for
Q106: Which of the following would be an
Q117: Referring to Table 10-8,construct a 99% confidence
Q120: For sample sizes greater than 30,the sampling
Q141: Referring to Table 10-14,what is the value
Q169: Referring to Table 10-9,if you want to