TABLE 9-1
Microsoft Excel was used on a set of data involving the number of defective items found in a random sample of 46 cases of light bulbs produced during a morning shift at a plant.A manager wants to know if the mean number of defective bulbs per case is greater than 20 during the morning shift.She will make her decision using a test with a level of significance of 0.10.The following information was extracted from the Microsoft Excel output for the sample of 46 cases: 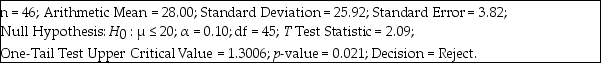
-True or False: Referring to Table 9-1,the null hypothesis would be rejected if a 1% probability of committing a Type I error is allowed.
Definitions:
Q13: Referring to Table 9-11,if you select a
Q18: True or False: A sample is used
Q30: Referring to Table 11-8,the among-block variation or
Q39: True or False: Referring to Table 9-8,the
Q40: Referring to Table 10-3,suppose α = 0.10.Which
Q50: Referring to Table 10-12,construct a 90% confidence
Q64: It is desired to estimate the mean
Q89: True or False: F tests are one-tail
Q96: Referring to Table 10-10,what is the value
Q138: True or False: Referring to Table 9-7,the