Hockey Teams
An avid hockey fan was in the process of examining the factors that determine the success or failure of hockey teams.He noticed that teams with many rookies and teams with many veterans seem to do quite poorly.To further analyze his beliefs he took a random sample of 20 teams and proposed a second-order model with one independent variable,average years of professional experience.The selected model is y = β0 + β1x + β2x2 + ε,where y = winning team's percentage,and x = average years of professional experience.The computer output is shown below. THE REGRESSION EQUATION IS y = 32.6 + 5.96x− .48x2 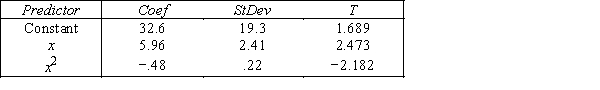 S = 16.1 R−Sq = 43.9% ANALYSIS OF VARIANCE
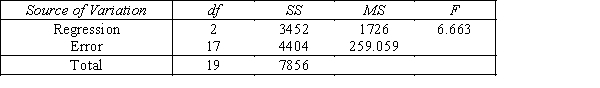
-{Hockey Teams Narrative} Predict the winning percentage for a hockey team with an average of 6 years of professional experience.
Definitions:
Production Possibilities Curve
A graphical representation of the maximum quantities of two goods or services that an economy can produce when utilizing its resources fully and efficiently.
Circular Flow Diagram
A visual model of the economy that shows how dollars flow through markets among households and firms, illustrating the interdependencies of economic activities.
Markets For Goods
Platforms or locations where goods are bought and sold, encompassing both physical locations and virtual marketplaces.
Efficient Production Possibilities
A concept in economics indicating the maximum output levels achievable with given resources and technology.
Q7: {Coffee Narrative} Which test is appropriate for
Q13: {The Pyramids of Giza Narrative} Calculate the
Q13: {Real Estate Builder Narrative} Suppose the builder
Q16: {Marc Anthony Concert Narrative} Does it appear
Q22: {Holiday Hours Narrative} Calculate the seasonal indexes
Q32: The effect of an unpredictable,rare event will
Q54: The data for analysis by a Friedman
Q100: The Kruskal-Wallis test is a nonparametric alternative
Q109: We can incorporate any nominal variable into
Q225: {Truck Speed and Gas Mileage Narrative} Calculate