Oil Quality and Price
Quality of oil is measured in API gravity degrees--the higher the degrees API,the higher the quality.The table shown below is produced by an expert in the field who believes that there is a relationship between quality and price per barrel. 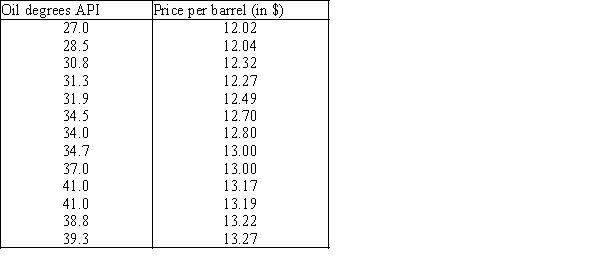 A partial Minitab output follows: Descriptive Statistics Variable N Mean StDev SE Mean Degrees 13 34.60 4.613 1.280 Price 13 12.730 0.457 0.127 Covariances Degrees Price Degrees 21.281667 Price 2.026750 0.208833 Regression Analysis Predictor Coef StDev T P Constant 9.4349 0.2867 32.91 0.000 Degrees 0.095235 0.008220 11.59 0.000 S = 0.1314 R−Sq = 92.46% R−Sq(adj)= 91.7% Analysis of Variance Source DF SS MS F P Regression 1 2.3162 2.3162 134.24 0.000 Residual Error 11 0.1898 0.0173 Total 12 2.5060
-{Oil Quality and Price Narrative} Draw a histogram of the residuals.
Definitions:
Substitute Products
Goods or services that can serve as replacements for each other; when the price of one goes up, the demand for the other might increase.
Information-Based
Referring to processes, businesses, or systems that primarily rely on data and information to function or provide value.
Manufacturing
The process of producing goods and products in large quantities through the use of labor, machines, tools, and chemical or biological processing.
Robotic Pizza Delivery
The use of autonomous robots to deliver pizzas from the restaurant to the customer's location.
Q3: {Game Winnings & Education Narrative} Predict with
Q12: The spread in the residuals should increase
Q33: {Student's Final Grade Narrative} Does this data
Q45: Multicollinearity is present if the dependent variable
Q51: Which of the following statements regarding
Q53: When an explanatory variable is dropped from
Q64: {Truck Speed and Gas Mileage Narrative} What
Q79: A nonparametric method to compare two or
Q95: When we describe a population of nominal
Q96: {Truck Speed and Gas Mileage Narrative} Calculate