Table 1.3 shows the hypothetical trade-off between different combinations of brushes and combs that might be produced in a year with the limited capacity for Country X, ceteris paribus. Complete the table by calculating the required opportunity costs for brushes and combs. 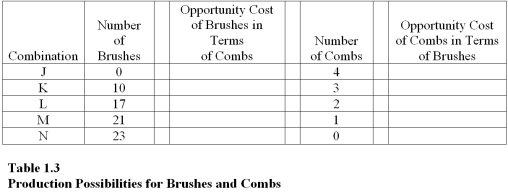 On the basis of your calculations in Table 1.3, in the production range of 21 to 23 brushes the opportunity cost of producing more comb in terms of brushes is
Definitions:
Increasing Returns to Scale
Occurs when an increase in all inputs by a certain percentage causes a more than proportional increase in output.
Decreasing Returns to Scale
Decreasing returns to scale occur when an increase in all inputs leads to a less than proportional increase in output, showing that the firm becomes less efficient as it scales up production.
Increasing Opportunity Costs
A situation where the cost of forgoing the next best alternative increases as more resources are devoted to an activity.
Scale Reduction
The process of decreasing the size or output level of operations in a business or economic system.
Q4: Discuss individual differences in the way people
Q11: The neurotransmitter that may stimulate appetite and
Q27: All economies must make decisions concerning what
Q35: Both men and women who drank alcohol:<br>A)
Q40: Which of the following is considered a
Q45: According to the World View titled "Income
Q55: In most states,a blood alcohol level of
Q80: "Demand" is a statement of actual purchases.
Q139: A U.S. firm that outsources jobs would
Q147: Micro and macro failures of the marketplace