Use the figure below to answer the following question.
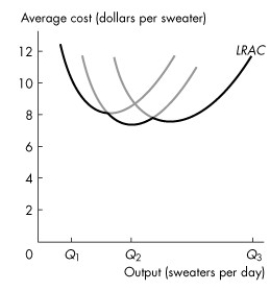 Figure 11.4.3
-Refer to Figure 11.4.3 which shows a firm's long-run average total cost curve.An increase in production from Q1 to Q2 sweaters per day produces
Definitions:
Likert Scale
A psychometric scale commonly involved in research that employs questionnaires, designed to gauge the attitude or response of a subject towards a set of criteria, using a linear scale.
Reliability
The degree to which an assessment tool produces stable and consistent results over multiple administrations or applications under the same conditions.
Validity
The extent to which a concept, conclusion, or measurement is well-founded and likely corresponds accurately to the real world.
100% Reliable
An absolute level of dependability and consistency in performance or outcome that is often considered unachievable in practice.
Q53: Refer to Figure 12.3.4 which shows cost
Q66: In general, (1)opportunity cost is greater than
Q69: Consumer surplus is<br>A)positive in the case of
Q77: A monopoly _ make positive economic profit
Q83: The marginal cost curve slopes downward at
Q88: Refer to Figure 12.4.3 which shows the
Q93: According to the marginal utility theory,consumers<br>A)maximize utility
Q113: Refer to Figure 9.3.4.Which graphs show the
Q115: Choose the correct statement.<br>A)Exports include goods and
Q117: Refer to Table 11.3.2,which gives Tania's total