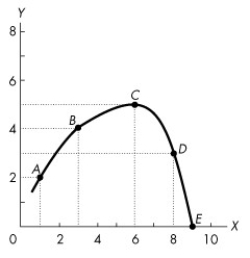
Use the figure below to answer the following questions.  Figure 1A.3.5
-Refer to Figure 1A.3.5.Which one of the following statements is true?
Definitions:
Market Shares
The percentage of an industry's sales that a particular company controls, indicating the company's strength in the market.
Boston Consulting Group (BCG)
A global management consulting firm known for its business strategy expertise and the BCG Matrix, a tool for portfolio analysis.
Portfolio Analysis
A tool or method used by investors and organizations to assess the potential or performance of a set of investments or business units.
Growth-Market Share Matrix
A strategic tool used by companies to evaluate their product portfolios and decide on actions like investment, divestiture, or growth strategies, based on market growth rates and relative market share.
Q2: Which one of the following correctly describes
Q10: Refer to the production possibilities frontier in
Q24: Jon,age 45,had adjusted gross income of
Q42: Salary earned by minors may be taxed
Q51: Premiums paid for life insurance policies are
Q54: For 2013,long-term capital gains are not afforded
Q55: Clark,a widower,maintains a household for himself and
Q60: A taxpayer with earned income of $50,000
Q73: As production of food increases,marginal benefit from
Q102: Refer to Table 3.4.1.If the price is