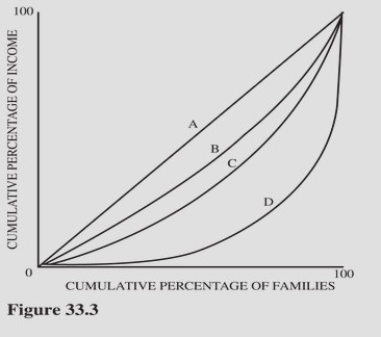
 Figure 33.3 illustrate four different Lorenz curves.Assume Brazil has a larger Gini coefficient than the United States.If the income distribution for the United States is represented by curve C,which curve would must represent the income distribution for Brazil?
Definitions:
Fixed Costs
Expenses that do not change as a function of the activity of a business, within the relevant period.
Break-Even Point
The level of sales at which total revenues equal total costs, resulting in no net loss or gain.
Sales Mix
The composition of a company’s product or service sales, showing the relative proportions of each product or service sold.
Net Income
The total revenue minus total expenses, indicating the profitability of a company over a specific period.
Q16: If leisure activities become more attractive,there will
Q16: When a corporation issues a bond,it is<br>A)Issuing
Q66: Over a given period of time,if exports
Q67: Financial intermediaries<br>A)Increase search and information costs for
Q76: Relative to nonunion wages,one reason union wages
Q98: The values of the Gini coefficient range
Q98: Suppose a poverty program has a basic
Q124: A World View titled "Export Ratios" examines
Q128: Suppose Russia can produce either 600 pianos
Q133: The determinants of the market supply of