Use the following figure to answer the questions : Figure 8.3: 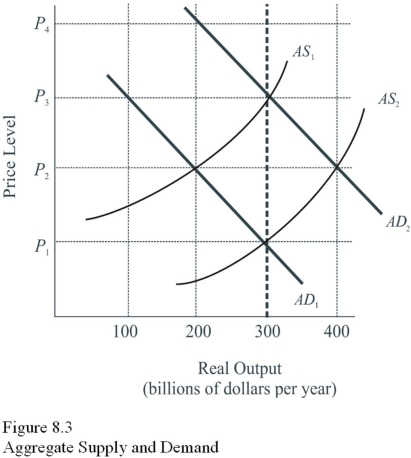
-Given AD1 and AS1 in Figure 8.3,the classical approach to achieving full employment at an output of $300 billion would be to
Definitions:
Profitability Index
A financial metric that measures the relative profitability of an investment, calculated as the present value of future cash flows divided by the initial investment cost.
Present Value
The current value of a future sum of money or stream of cash flows given a specified rate of return.
Initial Investment
The amount of capital put into a project or business at the beginning, often used in capital budgeting to analyze potential returns.
Life Of Equipment
The estimated duration for which equipment can be expected to operate effectively and be used productively by a business.
Q27: Resources are directed from one industry to
Q28: A "free rider" is an individual who
Q35: Assume nominal GDP is $10,000 billion in
Q62: Supply-side theories of the business cycle focus
Q67: Current buyers' and sellers' behaviors are correctly
Q79: A positively sloped aggregate supply curve reflects<br>A)The
Q85: The wearing out of plants and equipment
Q96: A tax cut has a smaller impact
Q104: If consumers spend 90 cents out of
Q129: The value of total output must equal