Essay
Figure 15.18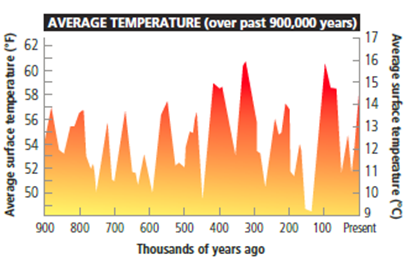
-In the accompanying chart showing temperature for the past 900,000 years,describe the natural phenomena that may have caused the temperature fluctuations shown.
Analyze the economic effects of monopoly on income distribution.
Describe the conditions for effective price discrimination in monopoly.
Understand the relationship between demand elasticity and monopolist's pricing decisions.
Recognize the implications of patents and monopolistic barriers to entry on firm behavior and market structure.
Definitions:
Related Questions
Q2: A tax on the amount of CO<sub>2</sub>
Q17: Government _ keep the price of water
Q39: marble<br>A)sedimentary<br>B)igneous<br>C)metamorphic
Q50: Muhammad Yunus and his Grameen Bank received
Q54: What is the root cause of food
Q60: Since 1942,the use of synthetic pesticides has
Q62: What is the international problem regarding mining
Q64: What kind of subsidies can governments use
Q81: What are two ways to save money
Q82: Production of fossil fuels from shale rock