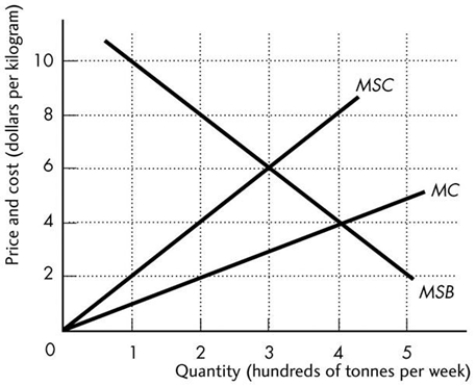
-The above figure shows the marginal private cost curve, marginal social cost curve, and marginal social benefit curve for blue fin tuna, a common resource. The market equilibrium with no government intervention is
Definitions:
Sales Tax
A tax levied on sales of goods and services, typically calculated as a percentage of the purchase price, paid by consumers at the point of sale.
Interest Rates
Charges applied on borrowed money or returns on invested capital, which vary based on the time, inflation, risk, and liquidity.
Tax Reform
Changes made to improve a tax system, often involving amendments to tax laws and policies.
Supply Curve
A chart that illustrates the amount of a product that suppliers are prepared to produce and sell at various price points.
Q13: Efficiency occurs in a market when<br>A) consumer
Q19: The figure above shows the market for
Q26: The table above gives the demand for
Q28: A monopoly<br>A) is not protected by barriers
Q37: Compared to a similar perfectly competitive industry,
Q52: To achieve allocative efficiency, an economy<br>A) must
Q54: Relative to free trade, domestic consumers of
Q54: Patents<br>A) remove legal barriers to entry.<br>B) are
Q84: Mark owns a cattle station near Darwin.
Q95: If the price of one good increases