Multiple Choice
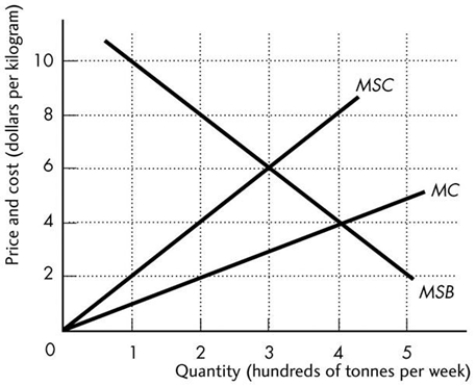
-The above figure shows the marginal private cost curve, marginal social cost curve, and marginal social benefit curve for blue fin tuna, a common resource. The market equilibrium with no government intervention is
Definitions:
Related Questions
Q6: The above figure shows the Australian market
Q17: Rate of return regulation is designed to
Q55: Why are the losers from free international
Q60: Anna owns a dog-grooming salon in Brunswick.
Q65: When a firm is able to engage
Q68: Use the figure above to answer this
Q79: What is the difference between perfect competition
Q83: Which of the following is NOT correct
Q86: The short run is a time period
Q120: One of the tendencies that is common