Multiple Choice
The diagram below shows the demand and supply curves for refrigerators in Canada. 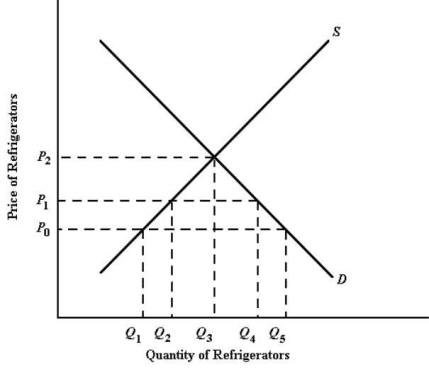 FIGURE 33-1 Refer to Figure 33-1.Suppose P0 is the world price.If Canada imposes a tariff causing the price of refrigerators in Canada to rise from P0 to P1,the consequence would be that
Definitions:
Related Questions
Q4: Suppose there is a recessionary gap and
Q19: Follett viewed organizations as _ in which
Q21: If the actual unemployment rate is one
Q37: The ongoing process of globalization of the
Q56: Which of the following is an example
Q56: (NAFTA is currently being renegotiated,but was still
Q71: _ states that managers assume people are
Q95: Consider the following variables: G = government
Q101: A country that engages in no foreign
Q102: Refer to Figure 34-1.A rise in the